

The move is not magic; it is arithmetic. A married couple in Los Angeles earning $160,000 pays about $8,500 a year in California income tax and State Disability Insurance (SDI) on a standard-deduction return. In Texas, both lines are $0. The bigger number is housing. At 20% down and 7%, the Los Angeles median home costs about $6,716 a month in principal, interest, and property tax; the San Antonio median costs about $1,884. After the income-tax effects and federal deductions modeled below are counted, the same hypothetical household produces an annualized modeled cost difference of approximately $4,580 per month in San Antonio proper, $3,100 in Boerne, $1,880 in Fair Oaks Ranch, and $1,140 in Bulverde, before the excluded household costs listed below. That is approximately $55,000, $37,200, $22,500, and $13,700 a year, respectively, before insurance, utilities, HOA costs, transportation and other household expenses. The Hill Country costs more than San Antonio proper, and the modeled annual difference still runs to five figures a year.
One important distinction: this is a current-market purchase comparison, not a reconstruction of an existing California homeowner's actual budget. If you already own in California, your mortgage balance, interest rate and Proposition 13 assessment may make your present housing cost much lower than this Los Angeles benchmark. Before treating any figure below as spendable savings, replace the California housing inputs with your actual mortgage payment, property tax and insurance.
This article runs the math line by line: the income tax line, the housing line, the property tax line, and what the difference compounds to over three decades. Major external inputs carry bracketed sources, while modeled outputs are calculated from the assumptions stated alongside the tables. The modeled figures are labeled as illustrations so you can rerun them with your own numbers. Two choices make the comparison concrete rather than abstract. First, the household is a married couple filing jointly at $160,000 gross, a realistic professional income in both states. Second, the housing comparison anchors on the San Antonio area, using median-priced homes in San Antonio proper, Boerne, Fair Oaks Ranch, and Bulverde—four representative markets within a broader practice area that also includes Bandera County [3][4][5][6][7]. If your income or your target town differs, the structure still works; only the columns change.
The article is organized as a blueprint. Section 1 covers the income tax superpower. Section 2 compares current median prices, price per square foot, down payments, and modeled mortgage payments across Los Angeles and the four Texas markets. Section 3 gives the honest property tax tradeoff, including the $140,000 homestead exemption and the 10% appraisal cap. Section 4 is the wealth unlock calculator, the central table, plus a compounding table that shows what the surplus does over time. Section 5 names the tradeoffs that are real, and the FAQ answers the questions that come up every time someone runs these numbers for real.
The 0% state income-tax difference
The roughly $8,500 annual difference for the article's standard-deduction example, before housing is considered.
More square footage for your dollar
Median prices and mortgage payments in Los Angeles, San Antonio, Boerne, Fair Oaks Ranch, and Bulverde.
The Texas property tax shield
The honest rate tradeoff, the $140,000 homestead exemption, and the 10% appraisal cap.
The wealth unlock calculator
The central table, plus what the surplus compounds to at an illustrative 5% nominal annual return.
The honest tradeoffs
Heat, the grid, insurance, car dependence, and the situations where the arithmetic may not win.
Coming from the Bay Area?
San Francisco and San Jose baselines against the same four Texas markets, on the same assumptions.
The questions people actually ask
Eight plain-English answers with citations, from income tax to the 10% cap.
1. No State Income Tax: What It's Worth at $160,000.
Texas has no state personal income tax. In 2019, voters adopted Proposition 4, adding Article VIII, Section 24-a to the Texas Constitution. It provides that the Legislature may not impose a tax on the net incomes of individuals. Because that prohibition is in the Texas Constitution, reversing it would require another constitutional amendment—approval by two-thirds of the elected members of each legislative chamber followed by approval by Texas voters [15]. Wages, salaries, interest, and most personal income are not taxed at the state level, and there is no Texas income tax return to file for employment income. California taxes personal income at rates from 1% to 12.3%, plus a 1% Mental Health Services Tax on taxable income above $1 million, for a top rate of 13.3% [1]. A $160,000 joint return just crosses into the 9.3% bracket, which starts at $145,448 of taxable income for 2025 [1]. The difference is not a loophole; it is a structural feature of how the two states fund themselves.
Here is the arithmetic for the household in this article. A married couple filing jointly at $160,000 gross, taking California's $11,412 standard deduction, has $148,588 of taxable income. The 2025 Franchise Tax Board rate schedule puts the tax at $6,696, less the $306 personal exemption credit, for roughly $6,400 a year in California state income tax [1][14]. California also withholds State Disability Insurance at the 2026 rate of 1.3% on all wages, which adds roughly $2,080 a year [2]. In Texas, both lines are $0. That is about $8,500 a year, or roughly $705 a month, that stays in the household's pocket from the first paycheck after the move. One caveat: a California homeowner carrying a large mortgage usually itemizes, which cuts the California income tax line sharply. The calculator in Section 4 models that case, along with the federal deductions that change when you move.
California income tax and SDI at $160,000, married filing jointly
| Line | California | Texas |
|---|---|---|
| State income tax (2025 brackets, standard deduction) | ~$6,390 a year | $0 |
| SDI withholding (2026, 1.3%) | ~$2,080 a year | $0 |
| Total California income tax and SDI | ~$8,470 a year | $0 |
| Kept by the household by moving | n/a | ~$8,500 a year (~$705 a month) |
Modeled illustration. The income-tax estimate uses the 2025 FTB rate schedule with the $11,412 standard deduction and $306 personal exemption credit for married filing jointly [1][14]; the SDI line uses the 2026 rate of 1.3% on all wages [2]. Your deductions and credits will move the exact figure.
For a $160,000 married household that would otherwise take California's standard deduction, the approximately $8,470 annual income-tax-and-SDI difference is equivalent to about $705 a month. A homeowner with enough mortgage interest and property tax to itemize may have a materially smaller California income-tax difference; the Los Angeles homeowner modeled in Section 4 is an example. That is the honest version of the raise the move creates, and it is worth stating what it is not: it is not a tax dodge, and it is not free money. California's SDI deduction funds the state's Disability Insurance and Paid Family Leave programs, so the withholding is not pure waste; it buys a real benefit while the worker is in California. For a worker whose employment becomes covered outside California, California SDI withholding ordinarily ends when payroll is correctly changed. Multistate and remote-work situations can be more complicated because California applies specific rules to determine which state covers the employment [27]. Two details matter in the year you move: you will generally file a part-year California return, and California can still tax California-source income after you leave, such as equity compensation earned while you worked there or rent from a California property you keep. Remote workers should confirm their employer's payroll switches to Texas on the move date.
The full mechanics of how a California paycheck becomes a Texas paycheck, including what happens to stock options, restricted stock, and employer payroll, are covered in the income tax arbitrage article. For this article, the line that matters is the one above: about $8,500 a year, before housing is even mentioned.
2. What Housing Dollars Buy in Los Angeles and the San Antonio Area
Now the housing line, which is where the comparison becomes substantial. Over the three months ending August 2026, the Los Angeles city median sale price was approximately $1.055 million [3], compared with approximately $265,000 in San Antonio, $505,000 in Boerne, $719,000 in Fair Oaks Ranch, and $864,000 in Bulverde [4][5][6][7]. Median sale prices per square foot were approximately $621 in Los Angeles, $148 in San Antonio, $215 in Boerne, $199 in Fair Oaks Ranch, and $262 in Bulverde. These are market-level medians rather than descriptions of any particular property, but they provide a consistent snapshot of the purchasing-power difference among the five markets.
Smaller markets can produce more volatile short-term medians because fewer transactions make the mix of homes sold more influential. That is especially important in Bulverde, where Redfin recorded only 27 sales in August 2026 and the three-month median was up 33.6% year over year. Treat these figures as a current market snapshot, not a prediction of what the next home will sell for.
The mortgage math makes it concrete. At 20% down and a 30-year fixed rate of 7%, an assumption stated here and sourced below, the Los Angeles payment on an $844,000 loan is roughly $5,617 a month [3][10]. The San Antonio payment on a $212,000 loan is roughly $1,410, the Boerne payment on a $404,000 loan is roughly $2,686, the Bulverde payment on a $691,000 loan is roughly $4,600, and the Fair Oaks Ranch payment on a $575,000 loan is roughly $3,824 [4][5][6][7][10]. On principal and interest alone, the Los Angeles household pays about $4,207 more every month than a San Antonio household on the median home.
What the median home costs, principal and interest only
| Los Angeles | San Antonio | Boerne | Fair Oaks Ranch | Bulverde | |
|---|---|---|---|---|---|
| Median sale price | ~$1,055,000 | ~$265,000 | ~$505,000 | ~$719,000 | ~$864,000 |
| 20% down payment | ~$211,000 | ~$53,000 | ~$101,000 | ~$144,000 | ~$173,000 |
| Loan amount | ~$844,000 | ~$212,000 | ~$404,000 | ~$575,000 | ~$691,000 |
| Monthly principal and interest (30-year fixed at 7%) | ~$5,617 | ~$1,410 | ~$2,686 | ~$3,824 | ~$4,600 |
Modeled illustration at 20% down and a 30-year fixed rate of 7% [10]. Medians: Los Angeles city [3], San Antonio [4], Boerne [5], Fair Oaks Ranch [6], Bulverde [7].
Read the table as a budget, not a list of prices. The median-price and price-per-square-foot data show substantially greater purchasing power in the Texas markets shown here [3][4][5][6][7]. The age, condition, lot size, housing type and exact location of an individual property will vary. The 7% rate is a modeling assumption, not a quote. Freddie Mac's Primary Mortgage Market Survey put the average 30-year fixed rate at 7.03% for the week ending September 24, 2026, so the assumption tracks the current market [10]. Because the Los Angeles loan is the largest, a higher rate adds more dollars to the Los Angeles payment than to any Texas payment, and a lower rate narrows the gap; the direction of the comparison holds either way. On these assumptions, principal, interest and modeled property tax on the Los Angeles median equal approximately $6,716 a month, or about 50% of the household's $13,333 gross monthly income, before homeowners insurance or other debt. That is a housing-cost ratio, not the household's actual debt-to-income ratio. Fannie Mae's current guidance sets a maximum total DTI of 36% for manually underwritten loans, with increases up to 45% permitted when specified credit-score and reserve requirements are met. For casefiles underwritten through Desktop Underwriter (DU), the maximum allowable DTI is 50% [18]. Actual qualification depends on the complete borrower profile. Among the Texas examples, Bulverde is now the highest housing-cost scenario at approximately $5,860 a month, or about 44% of gross income before insurance.

Representative Hill Country housing. Market-level medians above show substantially lower purchase prices and price per square foot than Los Angeles. The 600k-800k budget article shows what that money actually reaches around Boerne.
For families weighing schools and lot size, the Boerne versus Fair Oaks Ranch comparison is the right next read.
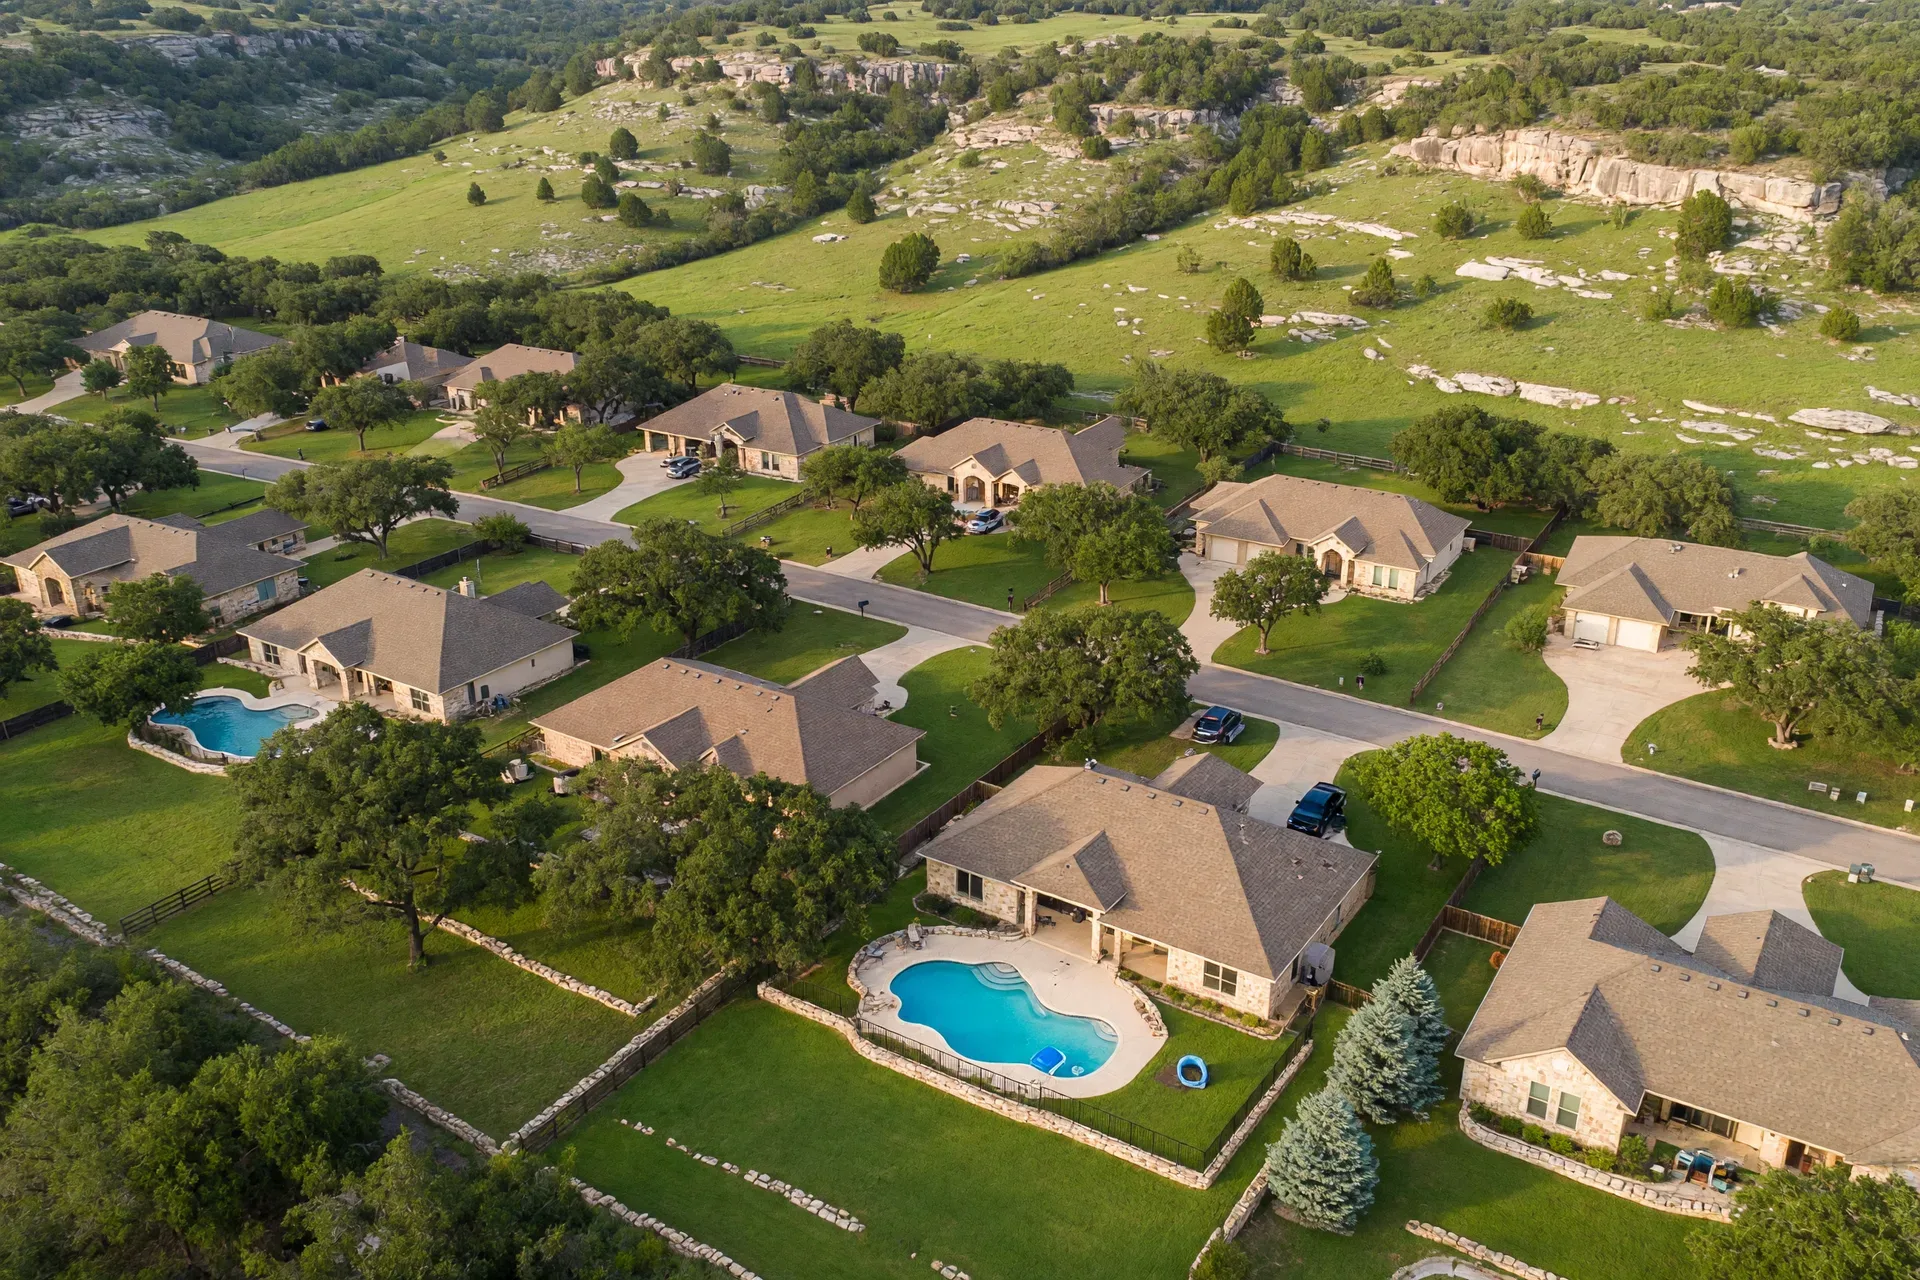
Representative Hill Country residential development. The market data above show substantially lower median prices and lower median price per square foot than Los Angeles; individual homes, lots and amenities vary [3][4][5][6][7].
3. Texas Property Taxes: The Tradeoff, Homestead Exemption and Appraisal Cap
The two states handle taxable home values differently. Texas property is appraised as of January 1. A midyear sale does not automatically reset that year's appraisal to the purchase price. If the previous owner's residence-homestead appraisal limitation had been protecting the property, that limitation does not simply transfer to the buyer. The buyer's future taxable value and exemptions depend on the January 1 appraisal, the timing of the purchase, the previous owner's exemption status and the buyer's own qualification for a residence-homestead exemption.
Modeled Gross Property-Tax Comparison
| Los Angeles | San Antonio | Boerne | Fair Oaks Ranch | Bulverde | |
|---|---|---|---|---|---|
| Median home price | $1,055,302 | $264,825 | $504,666 | $718,524 | $864,282 |
| Modeled gross composite rate | 1.25% | 2.15% | 1.85% | 1.95% | 1.75% |
| Modeled annual property tax | $13,191 | $5,694 | $9,336 | $14,011 | $15,125 |
| Modeled monthly property tax | $1,099 | $474 | $778 | $1,168 | $1,260 |
For a consistent cross-market comparison, this table applies the article's modeled composite property-tax rate to the current median purchase price before exemptions. Treat that result as a standardized pre-exemption gross-tax proxy, not as a forecast of the tax bill for the calendar year in which a buyer closes. Because the composite rates themselves are modeled and address-specific rates can be higher or lower depending on the taxing jurisdictions, MUDs, special districts and other property-specific factors, the actual gross bill may be above or below this illustration. Actual Texas property taxes depend on the property's January 1 appraised value, taxing jurisdictions, exemptions, MUD or other special-district obligations, and the timing and circumstances of the purchase.
4. The Wealth Unlock Calculator
Now the central table, which is the whole article in one grid. It compares the $160,000 household in Los Angeles against the same household in San Antonio proper, Boerne, Bulverde, and Fair Oaks Ranch, with every assumption stated so you can check the arithmetic yourself.
Assumptions, stated plainly: a married couple filing jointly earning $160,000 in wages, with no children and no other income. For tax-modeling purposes, the household is also assumed to have no pretax 401(k), 403(b), HSA or similar payroll contributions; no IRA or other above-the-line deductions; no charitable or medical itemized deductions; and no tax credits beyond the California personal exemption credit specifically described below. Housing uses a 30-year fixed mortgage at 7% with 20% down [10] on the median home in each market [3][4][5][6][7]. Modeled gross composite property-tax rates used for this comparison: Los Angeles 1.25%, San Antonio 2.15%, Boerne 1.85%, Bulverde 1.75%, and Fair Oaks Ranch 1.95% [13]. These percentages are standardized modeling assumptions informed by local adopted tax rates, not quoted tax rates for any specific address. For comparability, the Texas columns use a gross, pre-exemption property-tax proxy based on the current median purchase price. This is a standardized pre-exemption illustration, not a forecast of a buyer's first calendar-year tax bill. An actual bill can depend on the property's January 1 appraised value, the taxing jurisdictions attached to the address, the previous owner's exemption status, the buyer's qualification date, and any exemptions for which the buyer qualifies. California income tax uses the 2025 FTB rate schedule [1][14]; because the Los Angeles household carries an ~$844,000 mortgage, it itemizes mortgage interest and property tax on its California return. California's mortgage-interest deduction differs from the federal treatment: California does not conform to the federal $750,000 acquisition-debt limitation, so the California calculation uses the applicable California adjustment [21]. SDI is 1.3% of wages [2]. Federal income tax uses the 2026 brackets and $32,200 standard deduction for married filing jointly [12], with mortgage interest over the first 12 scheduled payments (deductible on up to $750,000 of loan balance [19]) and state and local taxes itemized wherever that beats the standard deduction. For 2026, the federal deduction for state and local income, sales and property taxes is subject to a $40,400 limit for married filing jointly at this income level [20]. To keep the comparison conservative and reproducible, the Texas columns do not include a federal itemized deduction for state and local general sales taxes. An actual Texas taxpayer who itemizes may be able to deduct eligible state and local sales taxes, subject to federal SALT limitations, which could reduce the modeled federal tax somewhat. The tax calculation represents a standardized full 12 months of ownership and mortgage payments. It is not intended to reproduce the tax return for the calendar year in which a buyer closes, which may contain only a partial year of mortgage interest and property taxes. Social Security and Medicare are the same in both states and are left out. Homeowners insurance, HOA dues, and utilities are excluded and covered in Section 5. All figures are modeled illustrations; your numbers will differ.
| Financial Metric | Los Angeles | San Antonio | Boerne | Fair Oaks Ranch | Bulverde |
|---|---|---|---|---|---|
| Gross household income | $160,000 | $160,000 | $160,000 | $160,000 | $160,000 |
| Median purchase price | ~$1,055,000 | ~$265,000 | ~$505,000 | ~$719,000 | ~$864,000 |
| Modeled gross property-tax rate | 1.25% | 2.15% | 1.85% | 1.95% | 1.75% |
| Monthly principal & interest | ~$5,617 | ~$1,410 | ~$2,686 | ~$3,824 | ~$4,600 |
| Monthly modeled property tax | ~$1,099 | ~$474 | ~$778 | ~$1,168 | ~$1,260 |
| Monthly housing before insurance | ~$6,716 | ~$1,884 | ~$3,464 | ~$4,992 | ~$5,860 |
| California income tax + SDI, annual | ~$4,220 | $0 | $0 | $0 | $0 |
| Federal income tax, first full 12-month model | ~$10,340 | ~$17,540 | ~$16,380 | ~$12,730 | ~$11,110 |
| Housing + income taxes, monthly | ~$7,930 | ~$3,346 | ~$4,829 | ~$6,053 | ~$6,786 |
| Modeled recurring monthly difference vs. Los Angeles, before excluded costs | Baseline | +$4,580 | +$3,100 | +$1,880 | +$1,140 |
| Modeled recurring annual difference vs. Los Angeles, before excluded costs | Baseline | +$55,000 | +$37,200 | +$22,500 | +$13,700 |
Modeled illustration. The modeled difference is the Los Angeles total (housing plus all income taxes) minus the same total in each Texas market, rounded to the nearest $10 a month and $100 a year. The figures reflect the first full 12 months of ownership; mortgage interest, and with it the federal deduction, declines every year.
The Los Angeles homeowner itemizes because of mortgage interest and state and local taxes. In this model, the San Antonio household uses the $32,200 federal standard deduction, while the Boerne, Fair Oaks Ranch and Bulverde households have enough modeled first-year mortgage interest and real-property tax to itemize. The federal-tax offset therefore varies substantially by Texas market.
For the Los Angeles federal calculation, mandatory California SDI is treated as a deductible state or local income tax on Schedule A, along with California income tax and qualifying real-property tax, subject to the federal SALT limit [28].
San Antonio proper produces the largest modeled difference because its median price is the lowest of the Texas markets compared here. Boerne follows at roughly $37,200 a year. Fair Oaks Ranch produces approximately $22,500, while Bulverde—whose current three-month median has moved substantially higher—produces approximately $13,700. Under this snapshot and these assumptions, the modeled Texas range is therefore approximately $13,700 to $55,000 a year.
What the Modeled Difference Could Compound To Over 30 Years
| Investment Horizon | San Antonio ($4,580/mo) | Boerne ($3,100/mo) | Fair Oaks Ranch ($1,880/mo) | Bulverde ($1,140/mo) |
|---|---|---|---|---|
| 5 years | ~$312,000 | ~$211,000 | ~$128,000 | ~$78,000 |
| 10 years | ~$712,000 | ~$482,000 | ~$292,000 | ~$178,000 |
| 20 years | ~$1.884 million | ~$1.275 million | ~$772,000 | ~$470,000 |
| 30 years | ~$3.815 million | ~$2.581 million | ~$1.562 million | ~$952,000 |
Modeled illustration: the unrounded first-full-year monthly difference is invested at the end of each month using a 5% nominal annual rate, divided by 12 and compounded monthly. Figures are nominal, are not adjusted for inflation, and are before investment fees and taxes. This is a mathematical annuity illustration, not an investment-return forecast. At a 7% nominal annual rate, divided by 12 and compounded monthly, the same constant San Antonio contribution would grow to approximately $5.593 million over 30 years.
One-time costs are separate. The recurring-difference model does not subtract the cost of selling the California property, buying the Texas property, moving household goods, temporary housing or travel, nor any taxable home-sale gain. Those costs should be calculated separately rather than mixed into the recurring monthly comparison.
Upfront Capital the Model Does Not Compound
| Los Angeles | San Antonio | Boerne | Fair Oaks Ranch | Bulverde | |
|---|---|---|---|---|---|
| 20% down payment at the current median | $211,060 | $52,965 | $100,933 | $143,705 | $172,856 |
| Less cash tied up than the Los Angeles 20% down payment | Baseline | $158,095 | $110,127 | $67,356 | $38,204 |
This is not recurring savings and should not be added to the annual modeled difference figures. It simply shows the difference in cash required for a 20% down payment at the current median prices. A household that already owns substantial California equity will have a different decision: it may choose to reduce the Texas mortgage, retain liquidity or invest part of the difference.

The wealth path is not only about the monthly budget. Home equity carried from California is the other half of the story.
The equity to wealth article runs the full version of this story with a $1.2 million sale and a Boerne purchase, including the capital gains line. The rent could buy a home article makes the same point from the renter's side.
What the Calculator Excludes
Not included in the recurring-difference calculation:
- Homeowners insurance
- Flood insurance where applicable
- HOA dues
- PID assessments or MUD-related costs not captured by the modeled tax rate
- Utilities
- Home maintenance
- Vehicle/commuting changes
- Selling and purchase closing costs
- Moving expenses
- Taxable gain on the California home, if any
- Changes in compensation after relocation
Replace these modeled omissions with property- and household-specific figures before treating the difference as disposable or investable cash.
5. The Honest Tradeoffs
Under the assumptions above, the model produces lower combined housing-and-income-tax costs in the four Texas examples, but it leaves out costs that are real in the Hill Country. These are the ones that change budgets.
Heat. San Antonio summers are long and hot, and July and August electric bills show it. Budget for higher cooling costs than coastal Los Angeles, especially in a larger home, and ask the seller for 12 months of utility history.
The grid. Most of Texas runs on the ERCOT grid, which has limited connections to neighboring grids. The February 2021 winter storm caused multi-day outages across much of the state. Many Hill Country owners now budget for a standby generator or battery backup.
Insurance. Texas property-specific insurance costs can vary substantially, so obtain an actual dwelling quote before committing to a property. Inland Texas homeowners policies commonly include wind and hail coverage, although deductibles can differ significantly by policy. Most homeowners policies do not cover flood damage; flood insurance is separate. New National Flood Insurance Program coverage generally has a 30-day waiting period before taking effect, although exceptions apply, including certain coverage purchased in connection with making, increasing, extending or renewing a mortgage loan [26].
Water and septic. Many low-density properties in Kendall and Comal counties rely on private wells, commonly drawing from the Trinity Aquifer, and on-site septic systems instead of city water and sewer. That may eliminate a municipal water-and-sewer utility bill, but private water and wastewater systems are not cost-free: owners should budget for electricity, testing, pump or pressure-system repairs, septic pumping and any locally required aerobic-system maintenance or inspections. Have the well and septic inspected before closing.
Taxes the calculator does not show. Newer subdivisions may sit inside a municipal utility district (MUD) or public improvement district (PID) that adds to the tax rate or bills an annual assessment, and many carry HOA dues. Ask for the full tax rate breakdown for the specific address, not the city average.
Car dependence. Outside central San Antonio, daily life in Boerne, Fair Oaks Ranch, and Bulverde requires a car for work, school, and errands, and most households need two. Peak-hour commutes into San Antonio on I-10 and US-281 can be slow.
When the arithmetic may not win. The math is weakest for three households: one that bought in California years ago with a low Proposition 13 base and a small mortgage, because its real housing cost is far below the modeled $6,716 a month; a remote worker whose employer cuts pay for relocating; and a California homeowner with taxable gain after applying any available principal-residence exclusion. A qualifying married couple filing jointly may generally exclude up to $500,000 of gain, subject to the federal ownership, use and look-back requirements [24]. California real-property gain that remains taxable can remain California-source income even after the seller has become a nonresident [25]. High-equity sellers should calculate adjusted basis—including qualifying capital improvements—and taxable gain before assuming that all sale proceeds are available for a Texas purchase. Run your own numbers before counting on the modeled difference.
Coming From the Bay Area?
Los Angeles is the baseline because it anchors the tables above, but the Bay Area deserves its own look: in my own relocation practice, a substantial share of California inquiries comes from the Bay Area. California's state tax rules are the same, but the actual tax dollars need not be. A different mortgage balance and property-tax bill can change both California and federal itemized deductions. To keep this sidebar directly comparable and avoid pretending to know each household's tax situation, the Bay Area table below compares housing costs only.
Using the same three-month period ending August 2026 as the other market comparisons, the San Francisco city median sale price was approximately $1.591 million, up 13.7% year over year, while San Jose was approximately $1.398 million, down 3.6% year over year. At the same 20% down and 7% mortgage assumption, and using the article's 1.25% modeled California property-tax rate for consistency, monthly principal, interest and modeled property tax are approximately $10,128 in San Francisco and $8,897 in San Jose before homeowners insurance [16][17].
The 7% rate is used here as a standardized comparison assumption, not as a financing quote. At the current San Francisco city median of $1,591,447, an 80% loan would be approximately $1,273,158, which is approximately $24,000 above the 2026 maximum one-unit high-cost conforming-loan ceiling of $1,249,125 [22]. Actual financing would therefore fall into jumbo territory and could price differently from Freddie Mac's conforming-market benchmark.
| Metric | San Francisco | San Jose | San Antonio Proper | Boerne | Bulverde | Fair Oaks Ranch |
|---|---|---|---|---|---|---|
| Median home price | ~$1,591,000 | ~$1,398,000 | ~$265,000 | ~$505,000 | ~$864,000 | ~$719,000 |
| Monthly housing, before insurance | ~$10,130 | ~$8,900 | ~$1,884 | ~$3,464 | ~$5,860 | ~$4,992 |
| Monthly gap vs. San Francisco | Baseline | — | +$8,240 | +$6,660 | +$4,270 | +$5,140 |
| Monthly gap vs. San Jose | — | Baseline | +$7,010 | +$5,430 | +$3,040 | +$3,910 |
Modeled illustration, housing only: 20 percent down, 30-year fixed at 7 percent, property tax at the Section 4 rate assumptions [13]. Table values are rounded to the nearest $10. San Francisco's actual new-buyer rate runs near 1.18 percent [23]; the table uses the same 1.25 percent with-bonds assumption as the Los Angeles columns for consistency. Bulverde at about $864,000 is now the highest Texas median and sits closest to the Bay Area baselines while still undercutting them by thousands a month. The underlying state-law rules are the same: Texas has no state personal income tax, California SDI no longer applies when the employment is covered outside California, and qualifying Texas homeowners may receive the applicable homestead exemption and appraisal limitation. The exact California income-tax difference should nevertheless be recalculated for the household because mortgage interest and other itemized deductions may differ from the Los Angeles example.
The honest caveat is the same one as the Los Angeles column, only stronger. Under the article's modeled 20% down payment, the housing cost alone is approximately 76% of gross monthly income in San Francisco and 67% in San Jose, before homeowners insurance or other debt. That makes these purchase scenarios unrealistic for a $160,000 household without substantially more cash down, additional qualifying income or a materially different financing structure. The Bay Area medians are therefore most useful here as housing-cost benchmarks rather than implied purchase recommendations. For the owner, the equity from a Bay Area sale usually does the heavy lifting: six figures of equity shortens the Texas mortgage, buys the lot, or covers the 20 percent down payment outright. For a renter, do not use the San Francisco or San Jose purchase column as the California baseline. Compare the household's actual California rent, renters insurance and parking or other recurring housing charges against the projected Texas ownership or rental cost. The result may still favor Texas, but it is a different calculation.
Frequently Asked Questions
The questions that come up every time a California household runs this arithmetic for real, answered straight.
How much do I actually save on income tax?
A married couple filing jointly at $160,000 gross that takes the standard deduction pays roughly $6,400 a year in California income tax on the 2025 FTB rate schedule, plus about $2,080 in SDI at the 2026 rate of 1.3%, for about $8,500 a year [1][2][14]. Texas has no state personal income tax, so both lines are $0 after the move. If you own a California home with a large mortgage, you likely itemize and pay less California income tax, and moving can raise your federal tax because you lose some of those deductions. The calculator in Section 4 models both.
Is Texas really cheaper if property taxes are higher?
In this model, total housing cost is lower in all four Texas examples even though the modeled Texas property-tax rates are higher than the Los Angeles rate. A new buyer in this service area pays roughly 1.75% to 2.15% on these assumptions, against about 1.25% on a new Los Angeles purchase, but the Texas home costs a fraction of the Los Angeles price [3][4][5][13]. In the calculator above, Los Angeles property tax runs about $1,099 a month on about a $1.055 million home, versus about $474 in San Antonio and $778 in Boerne. Under the corrected medians and modeled rates, both Fair Oaks Ranch (about $1,168 a month) and Bulverde (about $1,260 a month) have modeled gross property-tax dollars above the Los Angeles example, even though their total modeled housing costs remain below Los Angeles.
What is the homestead exemption and how do I file?
The residence homestead exemption takes $140,000 off the school-district taxable value of your primary home, approved by Texas voters in November 2025 and in effect for the 2025 tax year and every year after; homeowners 65 and older or disabled get an additional $60,000, for up to $200,000 combined [8][9]. Texas also allows taxing units to offer additional local homestead exemptions of up to 20% of value [8]. You generally do not need to reapply annually after the appraisal district grants the exemption, although the chief appraiser may require a new application in specified circumstances and appraisal districts periodically review existing homestead exemptions. The owner must also notify the appraisal district when eligibility ends. Apply once you own and occupy the property as your principal residence. Texas allows an owner who acquires a property after January 1 to receive the general residence-homestead exemption for the applicable portion of that tax year if the previous owner did not receive the same exemption for that year. Exact eligibility and filing circumstances should be confirmed with the appraisal district for the property's county. Qualifying homeowners age 65 or older or disabled may also receive a school-district tax ceiling, subject to Texas rules [8].
Does the 10% cap mean my tax bill cannot rise more than 10%?
No. The 10% appraisal cap limits how fast the appraised value of a homesteaded property can grow from year to year; it does not cap the total tax bill [11]. The limitation does not necessarily protect a new owner immediately: under Texas Tax Code Section 23.23, it takes effect on January 1 of the tax year following the first tax year in which the owner qualifies the property for the residence-homestead exemption. Your bill can still rise when taxing units raise rates, when voters approve new debt, or when the non-school portion of your taxes grows, so treat the cap as a brake on value growth, not a promise about your bill [8].
What mortgage rate did this article assume?
The calculator assumes a 30-year fixed rate of 7% with 20% down. Freddie Mac's Primary Mortgage Market Survey put the average 30-year fixed rate at 7.03% for the week ending September 24, 2026, so the assumption tracks the current market [10]. Changing the mortgage rate changes the size of the comparison, sometimes materially. Readers should rerun the calculation using an actual lender quote rather than assuming the 7% illustration applies to their transaction.
How much house can I get in Boerne, Fair Oaks Ranch, or Bulverde versus Los Angeles?
Over the three months ending August 2026, the Los Angeles city median sale price was about $1.055 million, while Boerne ran about $505,000, Fair Oaks Ranch about $719,000, and Bulverde about $864,000 [3][5][6][7]. The median-price and price-per-square-foot data show substantially greater purchasing power in the Texas markets shown here [3][4]. The age, condition, lot size, housing type and exact location of an individual property will vary.
Do I have to buy in San Antonio proper, or does this work in the Hill Country?
The same framework can be applied throughout the service area because the state income-tax and homestead rules are statewide, but the dollar results shown here apply only to San Antonio, Boerne, Fair Oaks Ranch and Bulverde. A Bandera County property—or any other target property—needs its own purchase price, taxing jurisdictions, insurance, HOA or special-district costs and utility assumptions. On this article's assumptions, the annual modeled difference runs from about $55,000 a year in San Antonio proper, to about $37,200 in Boerne, to about $22,500 in Fair Oaks Ranch, to about $13,700 in Bulverde.
I am coming from the Bay Area, not Los Angeles. Do these numbers still hold?
They hold, and the housing gap is larger. Using the same three-month period ending August 2026 as the other market comparisons, the San Francisco city median sale price was about $1.591 million and San Jose about $1.398 million, so the monthly housing gap to the four Texas markets runs from about $3,040 to about $8,240 on this article's assumptions [16][17]. The California tax regime is statewide, but the dollar savings may differ because the household's deductions may differ. The Bay Area figures in this article therefore compare housing only. The same baseline caveat applies: at $160,000, this household likely could not qualify for the Bay Area median, so read it as the home you already own or the one that is out of reach.
The Bottom Line
The arithmetic is less dramatic than the original headline numbers suggested, but the modeled difference remains substantial. Under the assumptions used here, the $160,000 household's combined housing and income-tax cost is approximately $7,930 a month in the Los Angeles scenario, compared with approximately $3,346 in San Antonio, $4,829 in Boerne, $6,053 in Fair Oaks Ranch and $6,786 in Bulverde. That produces a modeled recurring difference ranging from approximately $13,700 to $55,000 a year before insurance, utilities, HOA costs, transportation and other household expenses. For an actual relocation decision, replace every modeled housing input with the household's real California costs and the specific Texas property under consideration.
The Bay Area housing comparison is larger, but this article does not assume an identical homeowner tax bill for Los Angeles, San Francisco and San Jose. Different mortgage-interest and property-tax deductions can change both California and federal income tax. The Bay Area figures above should therefore be read as a housing-cost comparison; households should rerun the tax calculation using their own deductions.
None of this is magic, and none of it is hype. It is arithmetic with sources, and the sources are listed below so you can check every line. The difference is not a feeling. It is a budget that works differently every month.
What to do next, in plain terms. Run the calculator against your own income and your own target town, then spend a weekend driving the two ZIP codes you are actually choosing between. If you want help turning this blueprint into a move plan, Bill Ross at Hill Country Homesteads Group, brokered by Keller Williams Boerne, coordinates California-to-Texas purchases through a direct network of more than 1,100 California real-estate agents. Reach him through the contact page, by email at Bill@HillCountryHomesteads.com, or by phone at (210) 294-9190 during business hours, 8 AM to 6 PM Central, Monday through Friday. The brokerage is at 116 Herff Rd, Suite 203, Boerne, TX 78006. A no-pressure conversation about your specific situation is the only thing on offer.
For the younger side of the same decision, the Gen Z and millennial relocation article covers the San Antonio and Hill Country math for an earlier career stage. For the homestead and property tax side in more depth, the Hill Country Homesteads insights hub covers Boerne property taxes and community comparisons. For the estate and probate side of a cross-state move, the Texas probate guide at texasprobatehomes.net covers what happens to a Texas home after an owner passes.
Sources
Numbered sources, as cited in the body above. Primary authorities come first wherever one exists; secondary market-data sources are labeled as such.
- 2025 California Tax Rate Schedules (Form 540): brackets from 1% to 12.3%; the 1% Mental Health Services Tax on taxable income over $1 million brings the top rate to 13.3%: California Franchise Tax Board. www.ftb.ca.gov/forms/2025/2025-540-tax-rate-schedules.pdf
- Contribution Rates, Withholding Schedules, and Meals and Lodging Values: 2026 State Disability Insurance rate of 1.3% on all wages: California Employment Development Department. edd.ca.gov/en/payroll_taxes/rates_and_withholding/
- Los Angeles, CA Housing Market: median sale price about $1.055 million, three months ending August 2026: Redfin (secondary). www.redfin.com/city/11203/CA/Los-Angeles/housing-market
- San Antonio, TX Housing Market: median sale price about $265,000, three months ending August 2026: Redfin (secondary). www.redfin.com/city/16657/TX/San-Antonio/housing-market
- Boerne, TX Housing Market: median sale price about $505,000 at about $215 per square foot, three months ending August 2026: Redfin (secondary). www.redfin.com/city/2371/TX/Boerne/housing-market
- Fair Oaks Ranch, TX Housing Market: median sale price about $719,000 at about $199 per square foot, three months ending August 2026: Redfin (secondary). www.redfin.com/city/6483/TX/Fair-Oaks-Ranch/housing-market
- Bulverde, TX Housing Market: median sale price about $864,000 at about $262 per square foot, three months ending August 2026: Redfin (secondary). www.redfin.com/city/2901/TX/Bulverde/housing-market
- Property Tax Exemptions: the $140,000 residence homestead exemption, the additional $60,000 for age 65 or older or disabled, the partial-year rule for buyers, the school tax ceiling for qualifying homeowners age 65 or older or disabled, and the filing deadline (Tax Code 11.13): Texas Comptroller of Public Accounts. comptroller.texas.gov/taxes/property-tax/exemptions/
- Texas Proposition 13, Increase Homestead Property Tax Exemption Amendment (2025): raises the school-district residence homestead exemption from $100,000 to $140,000, retroactive to the 2025 tax year: Texas Comptroller of Public Accounts. comptroller.texas.gov/taxes/property-tax/exemptions/
- Primary Mortgage Market Survey: 30-year fixed average of 7.03% for the week ending September 24, 2026: Freddie Mac. www.freddiemac.com/pmms
- Texas Tax Code, Chapter 23, Section 23.23: limitation on the appraised value of a residence homestead (the 10% cap and when it takes effect): Texas Legislature. statutes.capitol.texas.gov/Docs/TX/htm/TX.23.htm
- IRS: tax inflation adjustments for tax year 2026, including the $32,200 standard deduction and 2026 brackets for married filing jointly: Internal Revenue Service. www.irs.gov/newsroom/irs-releases-tax-inflation-adjustments-for-tax-year-2026-including-amendments-from-the-one-big-beautiful-bill
- Modeled gross composite property-tax rates: the composite rates applied in this article's tables are modeled estimates for a new purchase, calculated on the corrected median prices. Official property-tax references by jurisdiction.
- Bexar Central Appraisal District, Truth in Taxation (property tax transparency)
- Bexar County Truth in Taxation database (Texas Comptroller)
- Kendall Appraisal District, adopted tax rates and exemptions
- Comal Appraisal District, property truth in taxation
- Comal County property-specific Truth in Taxation database (Texas Comptroller)
- Los Angeles County Auditor-Controller, Tax Rate Area tax-rate lookup
- Los Angeles County Auditor-Controller, Tax Rate Area lookup and rate files
- 2025 California Form 540 2EZ Tax Table, married filing jointly: $11,412 standard deduction and $306 personal exemption credit: California Franchise Tax Board. www.ftb.ca.gov/forms/2025/2025-540-2ez-taxtable-married.pdf
- Texas Constitution, Article VIII, Section 24-a: prohibition on a state personal income tax, adopted as Proposition 4 in 2019; removal requires a two-thirds legislative vote plus another statewide referendum: Texas Legislature. statutes.capitol.texas.gov/Docs/CN/htm/CN.8.htm
- San Francisco, CA Housing Market: median sale price $1,591,447 over the three months ending August 2026, up 13.7% year over year: Redfin (secondary). www.redfin.com/city/17151/CA/San-Francisco/housing-market
- San Jose, CA Housing Market: median sale price $1,398,019 over the three months ending August 2026, down 3.6% year over year: Redfin (secondary). www.redfin.com/city/17420/CA/San-Jose/housing-market
- Selling Guide B3-6-02: Debt-to-Income Ratios, including the maximum allowable DTI of 50% for casefiles underwritten through Desktop Underwriter and the 36% baseline with increases up to 45% permitted when specified credit-score and reserve requirements are met: Fannie Mae. selling-guide.fanniemae.com/
- Publication 936, Home Mortgage Interest Deduction: Internal Revenue Service. www.irs.gov/publications/p936
- Publication 505, Tax Withholding and Estimated Tax (2026): including the 2026 state and local tax deduction limit: Internal Revenue Service. www.irs.gov/publications/p505
- Schedule CA (540), California Adjustments: California's nonconformity with the federal $750,000 acquisition-debt limitation and related California adjustments to federal deductions: California Franchise Tax Board. www.ftb.ca.gov/forms/2025/2025-540-schedule-ca.pdf
- 2026 Conforming Loan Limit Values: maximum one-unit high-cost conforming-loan ceiling of $1,249,125: Federal Housing Finance Agency. www.fhfa.gov/DataTools/Downloads/Pages/Conforming-Loan-Limits.aspx
- Secured Property Taxes: FY 2026-27 secured property-tax rate, 1.18162182%: San Francisco Treasurer & Tax Collector. sftreasurer.org/property-taxes
- Topic 701, Sale of Your Home: the principal-residence gain exclusion of up to $250,000 single / $500,000 married filing jointly, subject to the ownership, use and look-back eligibility rules: Internal Revenue Service. www.irs.gov/taxtopics/tc701
- Publication 1100, Tax Information for Nonresidents: gain from California real property remains California-source income even when received or recognized by a nonresident, subject to the applicable rules: California Franchise Tax Board. www.ftb.ca.gov/forms/2025/2025-publication-1100.pdf
- National Flood Insurance Program: the 30-day waiting period before new coverage takes effect and its exceptions: FEMA. www.fema.gov/flood-insurance
- Multistate Employment: how California payroll tax and State Disability Insurance obligations apply when work is performed in more than one state: California Employment Development Department. edd.ca.gov/en/payroll_taxes/
- IRS Topic No. 503, Deductible Taxes: Schedule A itemized deductions for state and local taxes, including mandatory contributions to a state disability benefit fund: Internal Revenue Service. www.irs.gov/taxtopics/tc503
Last verified: September 29, 2026. Market medians change as new sales data is reported, while mortgage rates can move daily and Freddie Mac publishes its survey weekly; the figures here are the readings cited above and will drift. Confirm anything time-sensitive with the Texas Comptroller, your county appraisal district, the California Franchise Tax Board, the California Employment Development Department, the IRS, Freddie Mac, and a tax professional before relying on it. This is general educational information about taxes and real estate, not legal, tax, or financial advice for your specific situation. Bill Ross is available at (210) 294-9190 during business hours, 8 AM to 6 PM Central, Monday through Friday.