
A Question Many California Renters Are Asking
You have done the math. You have done it on your phone during lunch, on the couch after the kids are asleep, and in the carpool line while waiting for the bell. You know the number. It is the amount that leaves your bank account every month for a place you do not own, cannot modify, and will never sell for a profit.
Some months, it feels manageable. Other months, it feels like someone is quietly siphoning your future.
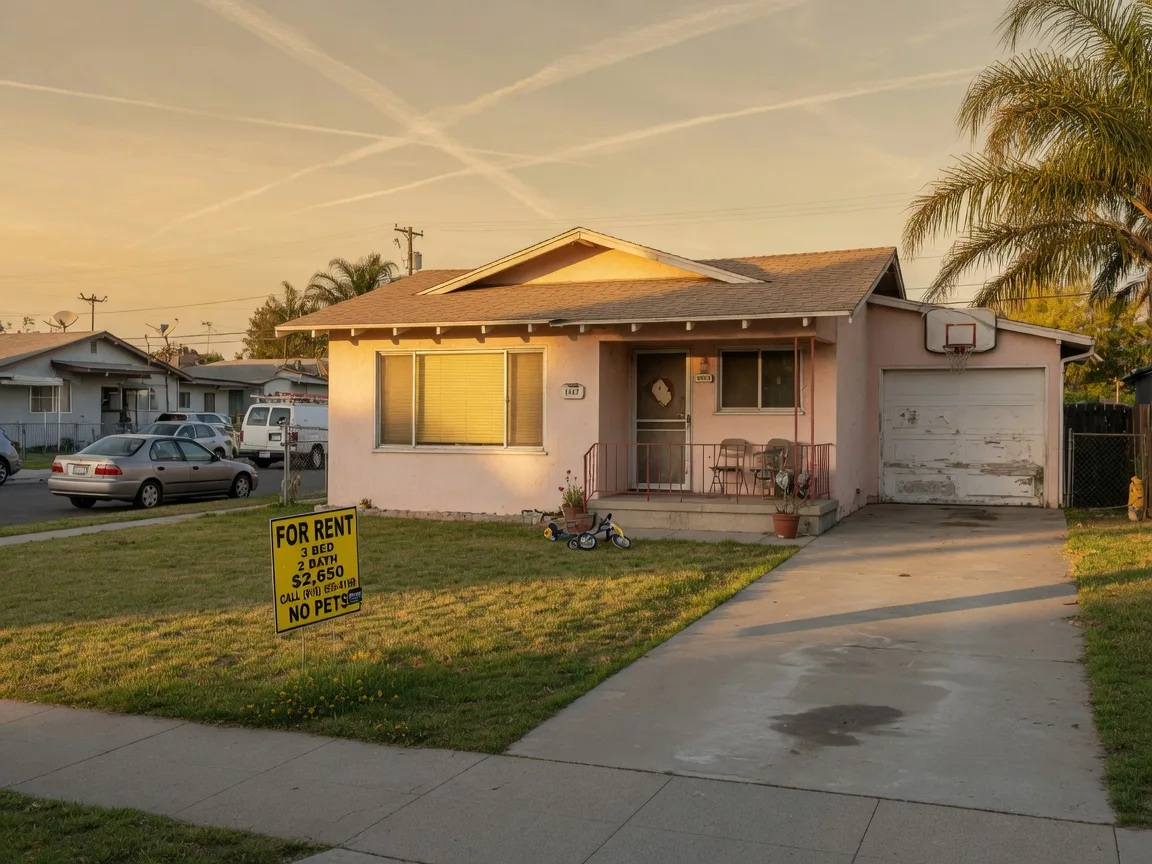
If you are renting a three-bedroom single-family home in one of California's highest-cost coastal markets, the advertised asking rent may be between roughly $4,295 and $8,200 a month. Rentometer's Mid-Year 2026 Single-Family Rental Market Report analyzed advertised asking rents collected from January 1 through June 30, 2026 for three-bedroom single-family homes. These figures are market medians, not the rent paid by every tenant and not the same as executed lease amounts [1].
Here is the question that keeps coming back when comparing costs between California and Texas: Could a similar monthly housing budget support homeownership somewhere else? For families considering the California-to-Texas cost picture, the answer often surprises them.
The Texas examples below show that it may. However, the source data do not establish that every median-priced property is a detached house with a yard, in move-in condition, or within a particular commute. Redfin's figures cover all home types, and mortgage qualification and property-specific costs must be evaluated separately.
This article compares published California asking rents with illustrative Texas ownership costs. It does not determine the mortgage for which any reader would qualify. Qualification depends on verified income, credit, existing debts, assets, cash to close, loan type, interest rate, property taxes, insurance and lender underwriting.

The Rent You Are Paying Right Now
Let us start with what you know: your rent.
If you live in San Francisco, your median three-bedroom rent is $5,280 a month. That is $63,360 a year going to your landlord. In Palo Alto, it is $6,300 a month. $75,600 a year. In Sunnyvale, $5,000. In Irvine, $4,800. In Los Angeles, $4,495. In San Jose, $4,395. In San Diego, $4,295 [1].
These figures represent median advertised asking rents for three-bedroom single-family homes. They are not limited to luxury properties, but a median does not describe every home's condition, location or amenities. Asking rents can also differ from the amounts ultimately agreed to in signed leases.
West Hollywood and Palo Alto are extreme cases, at $8,200 and $6,300 a month respectively. But even the other Bay Area cities in the table above are running $4,395 to $5,280 a month. That is $52,740 to $63,360 a year before you buy groceries, pay for daycare, or save a single dollar for retirement.
Median asking rents increased year over year in several of the specific markets highlighted here: 5.7 percent in San Francisco, 5.9 percent in San Jose and 11.1 percent in Sunnyvale. Those increases do not mean every tenant's rent rose by the same percentage, but they show that advertised single-family rental costs increased materially in those markets [1].
| California City | H1 2026 Median Asking Rent | Annualized Rent |
|---|---|---|
| West Hollywood | $8,200 | $98,400 |
| Palo Alto | $6,300 | $75,600 |
| San Francisco | $5,280 | $63,360 |
| Sunnyvale | $5,000 | $60,000 |
| Irvine | $4,800 | $57,600 |
| Los Angeles | $4,495 | $53,940 |
| San Jose | $4,395 | $52,740 |
| San Diego | $4,295 | $51,540 |
| Source: Rentometer Mid-Year 2026 Single-Family Rental Market Report. Figures are median advertised asking rents for three-bedroom single-family homes during the first half of 2026. Annualized rent equals the monthly asking-rent median multiplied by 12; it does not include utilities, renters insurance, deposits or future rent changes. | ||
What That Rent Could Buy in Texas
Now let us look at the other side of the equation.
Redfin reported a May 2026 median sale price of $309,796 for all home types in West San Antonio, based on the three months ending in May. The comparable median was $449,731 in the City of Boerne and $574,779 throughout ZIP code 78006 [2][3][4]. These are geographic, all-home-type medians, not medians limited to three-bedroom detached houses.
Here is what those numbers mean in monthly payments, based on a 20 percent down payment, a 30-year fixed-rate mortgage, and a 6.5 percent interest rate:
Using a 20 percent down payment, a 30-year fixed-rate mortgage and a 6.5 percent interest rate, a $309,796 purchase produces a loan of approximately $247,837 and a principal-and-interest payment of about $1,567 per month. A $449,731 purchase produces a loan of approximately $359,785 and a payment of about $2,274. A $574,779 purchase produces a loan of approximately $459,823 and a payment of about $2,906. These figures exclude property taxes, homeowners insurance, HOA dues, flood insurance, maintenance and closing costs.
Read those numbers again.
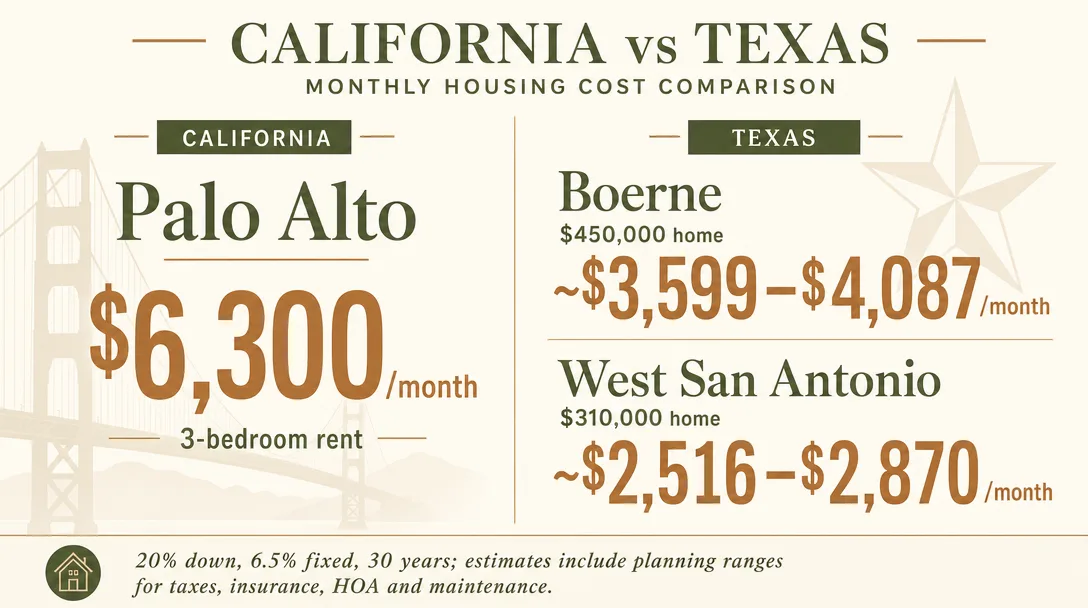
A $6,300 payment would equal the principal and interest on a purchase price of roughly $1.25 million under these loan assumptions, but that is not a realistic affordability calculation because it leaves nothing for taxes, insurance, HOA dues, maintenance or other debts. The more useful comparison is total estimated housing cost. Under the planning assumptions shown below, the $310,000 West San Antonio example costs approximately $2,516 to $2,870 per month, while the $450,000 Boerne example costs approximately $3,599 to $4,087. Both remain below the published $6,300 Palo Alto rent. The West San Antonio example equals about 40-46 percent of that rent, while the Boerne example equals about 57-65 percent. The West San Antonio example is less than half of the Palo Alto figure; the Boerne example is not.

The Disappearing Families
You are not the only person comparing family housing costs across cities. U.S. Census Bureau data analyzed by The Wall Street Journal show a pronounced demographic shift in large American cities, although the figures reflect both migration and a nationwide decline in births.
Between 2015 and 2024, the number of children under age 5 in the 38 U.S. cities with more than 500,000 residents fell 15 percent, compared with a 7 percent decline nationwide. The total under-18 population in those cities fell 6 percent, compared with 1 percent nationwide. About two-thirds of the 38 cities lost children during that period [5].
San Jose experienced a 20 percent decline in its under-18 population and a 34 percent decline among children under age 5. Los Angeles experienced a 16 percent decline in its under-18 population. Fort Worth's under-18 population increased 11 percent [5].
Housing and childcare costs are among the forces families cited, but the population data do not prove that every missing child represents a family that relocated. Lower birthrates also contributed to the decline. The evidence supports a demographic shift away from many high-cost cities, not the claim that every family is leaving solely because 'the math stopped working.'
A separate Census Bureau data set provides direct evidence of state-to-state migration. The 2024 American Community Survey estimated that approximately 77,000 people moved from California to Texas during the prior year, making California the largest source of new Texas residents from another state [6].
Some families are relocating, and the 2024 American Community Survey estimated approximately 77,000 moves from California to Texas. But that state-to-state total includes movers of all household types and does not show how many were families with children or why they moved. The decline in the number of children living in major cities also reflects lower birthrates, so the two data sets should not be presented as proving the same cause.
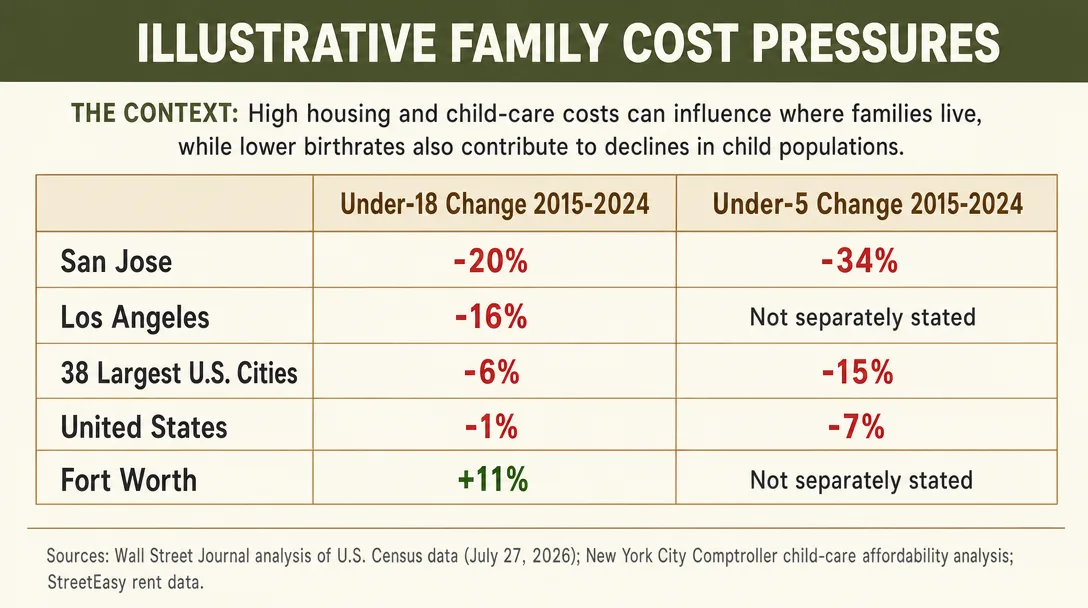
A separate analysis by the New York City Comptroller found that, using the federal benchmark of spending no more than 7 percent of income on child care, a family would need to earn roughly $334,000 per year to afford center-based care for a single two-year-old in New York City — illustrating the cost pressures that contribute to broader demographic trends [17].
| City or Benchmark | Under-18 Change, 2015-2024 | Under-5 Change, 2015-2024 |
|---|---|---|
| San Jose, CA | -20% | -34% |
| Los Angeles, CA | -16% | Not separately stated |
| 38 Largest U.S. Cities, Combined | -6% | -15% |
| United States | -1% | -7% |
| Fort Worth, TX | +11% | Not separately stated |
| Source: The Wall Street Journal analysis of U.S. Census Bureau data for 2015-2024. Large cities were defined as the 38 municipalities with populations above 500,000. City-level percentages should not be described as metro-area statistics. | ||

It Is Not Just the Rent
Housing is only one part of a relocation decision. Taxes, insurance, employment, commute patterns, climate, schools, healthcare, proximity to family and exposure to wildfire or flooding can all materially change the result.
California's maximum personal income-tax rate is 13.3 percent: a top statutory rate of 12.3 percent plus an additional 1 percent on taxable income above $1 million. That is a marginal rate and does not apply to every taxpayer [10]. California real property is generally reassessed to current fair market value when ownership changes, subject to statutory exclusions. A buyer normally does not inherit the seller's long-held Proposition 13 assessed value [11]. Texas does not impose an individual state income tax, but Texas homeowners generally face higher effective property-tax rates and substantial homeowners-insurance costs.
School and crime comparisons should be based on current, address-specific public data rather than broad characterizations. Boerne ISD earned a 92/A overall rating in the Texas Education Agency's 2025 accountability system and currently reports more than 11,000 students across 14 schools [12][13]. Buyers should still verify the assigned district and campus for each property because city limits, ZIP codes, mailing addresses and school-attendance boundaries do not always match.
For a deeper look at the emotional and practical reasons families find it hard to leave California, even when the financial case is clear, see our article on Why It's So Hard to Leave California.
Texas is not perfect. Every state has tradeoffs. But for families who feel stuck, paying more and getting less, the Hill Country offers something that is increasingly hard to find in coastal California: a place where the cost of living makes room for the life you actually want to live.
The Math Is Real. But So Is What the Math Leaves Out.
The principal-and-interest figures above are only the loan payment. A complete ownership budget must also consider property taxes, homeowners insurance, HOA dues, flood insurance where applicable, maintenance, utilities, closing costs and mortgage insurance when the down payment is below 20 percent.
Using the article's assumptions, property taxes and homeowners insurance alone add approximately $692 to $896 per month to the West San Antonio example and approximately $950 to $1,238 to the Boerne example before considering HOA dues, maintenance or flood coverage. Actual taxes must be calculated for the specific address and adjusted for applicable exemptions. Insurance must be quoted for the specific house because premiums depend on replacement cost, roof age, location, claims history, credit-based insurance factors and coverage selections.
Texas Department of Insurance data show a preliminary 2025 statewide average homeowners premium of $3,506 per year, or about $292 per month. That statewide figure is a benchmark, not a quote for any particular property, and it is not broken out by home value or county, so it should not be read as contradicting the lower per-example estimates above, which scale with each property's estimated replacement cost [8].
In the examples shown, estimated Texas ownership costs remain below the published California asking rents used for comparison. That does not establish the result for "most families": the outcome depends on the specific rent, property, down payment, mortgage terms, taxes, insurance, HOA or special-district charges, maintenance and the buyer's other obligations. The narrower conclusion supported by the data is that a monthly outlay comparable to the $6,300 Palo Alto asking-rent median may cover the estimated ownership costs of the Texas examples shown here.
| Cost Component | West San Antonio ($310K Home) | Boerne ($450K Home) | Boerne 78006 ($575K Home) |
|---|---|---|---|
| Principal and Interest (20% down, 6.5%, 30-year fixed) | ~$1,567 | ~$2,274 | ~$2,906 |
| Property Taxes (gross planning estimate before exemptions) | ~$517-$646 | ~$750-$938 | ~$958-$1,198 |
| Homeowners Insurance (est.) | ~$175-$250 | ~$200-$300 | ~$250-$375 |
| HOA Dues or Other Recurring Assessments (where applicable) | $0-$150 | $0-$200 | $0-$300 |
| Maintenance Reserve (1% of value/yr) | ~$258 | ~$375 | ~$479 |
| Total Estimated Monthly Cost | $2,516 - $2,870 | $3,599 - $4,087 | $4,593 - $5,258 |
| These are conservative planning estimates, not quotes. The property-tax row applies a gross percentage to purchase price before homestead or other exemptions; actual taxes depend on appraised value, adopted rates, exemptions and all applicable taxing units, including any MUD or other special district. The insurance ranges are editorial estimates and should not be presented as county averages from TDI. Flood insurance, utilities, buyer closing costs and mortgage insurance are not included. HOA dues should be entered as $0 when the property has no mandatory association. | |||
Rent Buys Flexibility. A Mortgage Can Build Equity.
Rent pays for the right to occupy a home and generally transfers much of the repair and market-value risk to the property owner. It does not create real-property equity for the tenant. It is inaccurate, however, to say that every rent dollar goes to a landlord's mortgage and profit; landlords may also pay property taxes, insurance, repairs, management, vacancies and other operating costs, and some own their properties without mortgages.
A mortgage payment contains both interest and principal. On the $450,000 example, the initial $360,000 loan would decline to approximately $337,000 after 60 scheduled payments, meaning about $23,000 of principal would be repaid during the first five years. The down payment, principal reduction and any appreciation contribute to equity; depreciation and selling expenses reduce it.
Homeownership can create long-term value, but it is not automatically the better choice for every renter. A buyer needs sufficient cash, stable income, an appropriate ownership horizon and the ability to absorb repairs and market risk. Renting may be preferable when flexibility matters or when the buyer expects to move before the purchase and eventual selling costs can be recovered.

| Five-Year Illustration | Renting in Palo Alto | Buying in Boerne ($450K) | Buying in West San Antonio ($310K) |
|---|---|---|---|
| Monthly Planning Amount | $6,300 rent | ~$3,900 total budget | ~$2,700 total budget |
| 20% Down Payment | $0 | $90,000 | $62,000 |
| Five-Year Budgeted Housing Outlay (Monthly Planning Amount x 60) | $378,000 | ~$234,000 | ~$162,000 |
| Illustrative Home Value After 5 Years at 3% Annual Appreciation | N/A | ~$521,361 | ~$359,138 |
| Estimated Loan Balance After 60 Payments | N/A | ~$337,000 | ~$232,155 |
| Estimated Gross Equity After 5 Years | $0 | ~$184,362 | ~$126,983 |
| The five-year outlay row simply multiplies each monthly planning amount by 60. It assumes no change in rent, property taxes, insurance, HOA or assessment charges, or the maintenance budget, and it treats the maintenance reserve as budgeted cash even if it is not spent. The 3 percent annual appreciation rate is a hypothetical scenario used solely to illustrate how appreciation would affect equity. It is not a forecast and is not guaranteed. Gross equity equals estimated market value minus the remaining loan balance and already includes the original down payment, principal reduction and assumed appreciation. It is not profit or cash received at sale. The illustration excludes purchase closing costs, future selling expenses, taxes on a sale if applicable, changes in taxes and insurance, and the investment return a renter might earn on the down payment and monthly cash-flow difference. | |||
The Broader Boerne Reality
If you have started looking at Boerne online, you have probably noticed that the prices vary wildly. That is because "Boerne" means different things to different people.
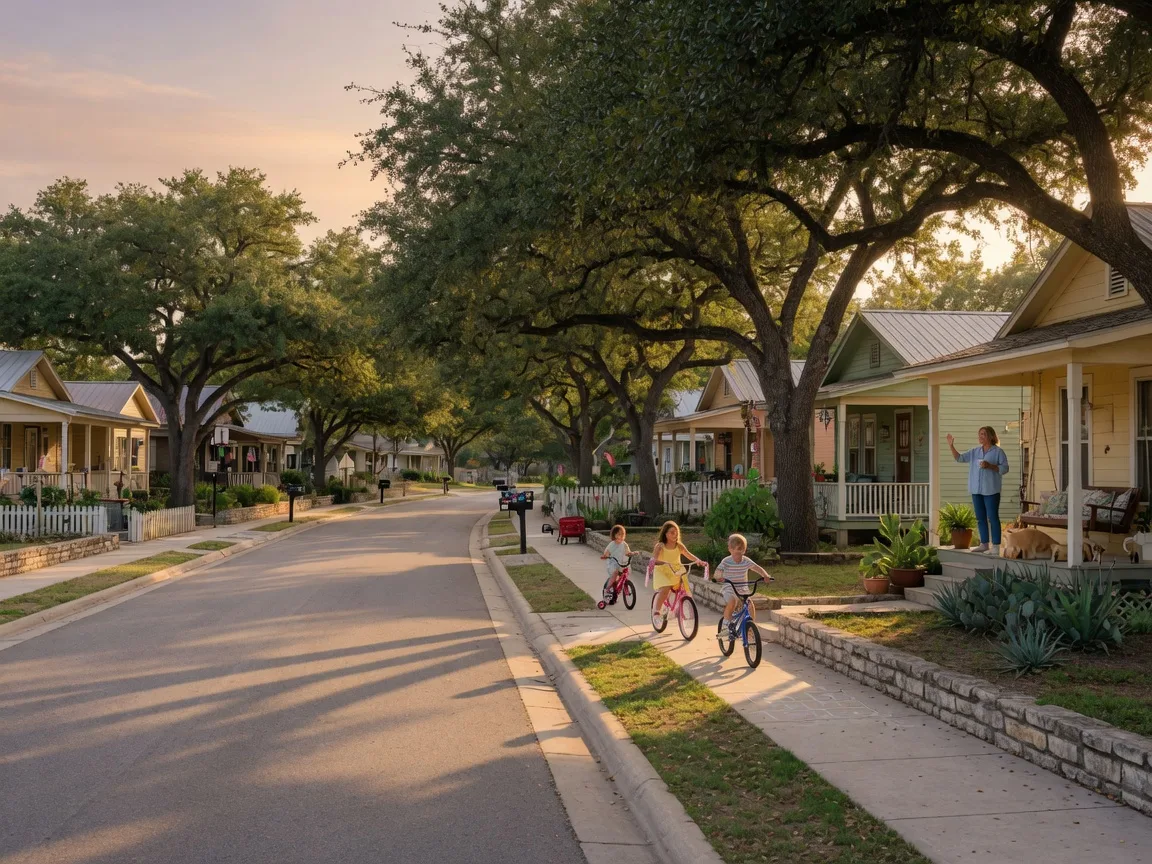
The City of Boerne had a median sale price of $449,731 for all home types in Redfin's May 2026 reporting period [3]. The broader 78006 ZIP code, which includes Cordillera Ranch, rural properties outside the city and other Hill Country communities, had a median of $574,779 [4]. Premium gated, acreage and custom-home communities can run well above that median.
If you are drawn to the Hill Country's oak trees, open space, slower pace and community character but find the Boerne price point too high, West San Antonio may offer an alternative. The area includes a broad mix of established neighborhoods and newer construction, but school assignments, tax rates, commute times and amenities must be verified for the specific address.
The right choice depends on your priorities: commute distance, school preferences, lot size, community feel, and budget. That is exactly the kind of conversation worth having with someone who knows both markets.
"The single most common reaction I hear from California buyers seeing homes in Boerne for the first time is not about the price. It is about the space. The yards, the garages, the square footage, the quiet street. They have been living in apartments that cost more than this house payment."
Bill Ross, Hill Country Homesteads Group
| Area | Redfin Reporting Basis | Median Sale Price | Illustrative Monthly P&I |
|---|---|---|---|
| West San Antonio | All home types; 3 months ending May 2026 | $309,796 | $1,567 |
| City of Boerne | All home types; 3 months ending May 2026 | $449,731 | $2,274 |
| ZIP Code 78006 | All home types; 3 months ending May 2026 | $574,779 | $2,906 |
| Principal-and-interest calculations assume 20 percent down, a 6.5 percent fixed rate and a 30-year term. Taxes, insurance, HOA dues, flood coverage, maintenance and closing costs are excluded. Redfin's medians cover all home types and should not be labeled "typical three-bedroom" prices. | |||
Your Family's Next Chapter
Families who have navigated this decision often describe the same process: run the numbers first, discuss priorities with your partner, and ask the hard questions before making a move. Can you qualify? What does the total monthly cost look like once taxes, insurance and maintenance are included? What are you giving up, and what are you gaining?
If you are at that stage, or even just beginning to wonder whether the math could work, the next step is straightforward: get a written lender preapproval, verify property-specific taxes with the appraisal district, and compare total estimated ownership costs for the specific property you are considering. Texas does not work for every family, but for families already spending $4,295 to $8,200 a month on rent, the numbers may be worth examining closely.


Written by
Bill Ross
Hill Country Homesteads Group, brokered by KW Boerne
Bill Ross is a Texas real estate agent with nearly four decades in high-tech sales and a network of 1,100+ California real estate agents for coordinated cross-state transactions. Featured in national coverage discussing his family's relocation from Silicon Valley to the Texas Hill Country.
Frequently Asked Questions
How much do I need to earn to qualify for a mortgage on a $450,000 Texas home?
At a 6.5 percent fixed rate with 20 percent down, the principal-and-interest payment on a $360,000 loan is approximately $2,275 per month. Using the article's planning ranges for taxes and insurance produces an estimated principal, interest, taxes and insurance payment of roughly $3,225 to $3,515 before HOA dues. Applying Freddie Mac's rough benchmark of no more than 30 percent of gross monthly income for principal, interest, taxes and insurance suggests gross annual income of approximately $129,000 to $141,000. That is a budgeting illustration, not a mortgage-qualification result. Lenders consider total monthly debts, verified income, credit, assets, loan type and other underwriting factors, and different loan products and lenders use different debt-to-income limits [9].
What happens to my California security deposit if I move to Texas and buy a home?
California generally requires a landlord to return the remaining security deposit or provide an itemized statement of deductions within 21 days after the tenant moves out. Since July 1, 2024, most California landlords have been limited to a security deposit equal to one month's rent. Qualifying small landlords may collect up to two months' rent, subject to additional restrictions [14]. Therefore, a $4,000 to $8,000 monthly renter should not be told that a typical deposit automatically equals two or three months of rent. The refund may replenish moving or homebuying funds, but it may arrive after the Texas closing and should not be counted as cash to close unless the lender confirms that it is available and properly documented.
Should I factor the Texas homestead exemption into my monthly budget?
Texas currently requires school districts to exempt $140,000 of an eligible residence homestead's taxable value. The increase from $100,000 to $140,000 was approved as Texas Proposition 13 in November 2025, not Proposition 5 [7]. At a school tax rate of $1.00 per $100 of taxable value, the school-district portion of the exemption would reduce taxes by approximately $1,400 per year. The general application deadline is before May 1, but Texas law permits certain late residence-homestead applications. A qualifying owner who acquires a home after January 1 may also receive the exemption for the applicable portion of that tax year if the previous owner was not already receiving the same exemption. File promptly with the county appraisal district and obtain an address-specific tax estimate.
How do Texas property taxes compare to what I pay indirectly as a renter in California?
A California renter does not receive the owner's property-tax bill, but property taxes, insurance, maintenance and other operating costs influence the economics of owning rental property. Rent is ultimately set by the rental market, however, so it is too simplistic to say that a landlord's entire property-tax bill "flows straight into" the tenant's rent. It is also inaccurate to assume that a long-held California rental is taxed at 1.2 percent of its current market value because Proposition 13 may leave its assessed value far below market value. A Texas buyer should compare the actual or estimated tax bill for the specific property, including exemptions and every applicable taxing unit.
Is it better to rent first in Texas before buying?
Renting first can provide time to test commute patterns, neighborhoods, school assignments and daily routines before committing to a purchase. Buying immediately avoids a second move and begins the ownership period sooner, but it creates greater risk if the buyer chooses the wrong location or expects to move again within a few years. The better choice depends on location certainty, lease cost, ownership horizon, cash reserves and market conditions.
What if I cannot afford a 20 percent down payment?
A 20 percent down payment is not required for every mortgage. Some conventional programs permit down payments as low as 3 percent; FHA loans may permit 3.5 percent; eligible USDA rural loans and VA-guaranteed loans may offer no-down-payment options. Eligibility, mortgage insurance, funding fees, income limits and property requirements vary. Texas programs offered through TSAHC and TDHCA may provide down-payment and closing-cost assistance, but the assistance is not always a grant. Depending on the program, it may be structured as a grant, deferred-forgivable second lien or deferred-repayable second lien, generally calculated as a percentage of the mortgage loan rather than the purchase price [15][16]. On a $450,000 purchase with 5 percent down, the loan amount would be $427,500 and the principal-and-interest payment at 6.5 percent would be approximately $2,703, about $428 more than with 20 percent down because more money is borrowed. Private mortgage insurance would be a separate, additional cost for many conventional borrowers with less than 20 percent down.
How do Texas schools compare to what I would get in California for the same housing cost?
Boerne ISD earned a 92/A overall rating in the Texas Education Agency's 2025 accountability system. The district reports more than 11,000 students across 14 schools. Rentometer's H1 2026 median asking rent for a three-bedroom single-family home in Los Angeles was $4,495. Under the article's illustrative assumptions, that budget exceeds the estimated monthly ownership cost of the $450,000 Boerne example, but mortgage qualification and placement within a particular attendance zone must be verified separately. Buyers should confirm the assigned campus for the exact address and review TEA's campus-level data rather than relying only on a districtwide label.
Related Guides
The Texas Homestead Exemption
How to file, how much you save, and the deadlines that matter for every new Texas homeowner.
Why California Buyers Underestimate Texas Property Taxes
The tax picture that surprises nearly every California transplant.
Property Tax Shock or Relief
A line-by-line comparison of California vs. Texas tax bills for comparable homes.
What a $600K, $800K, and $1.2M Budget Actually Buys
Hill Country vs. Bay Area and coastal LA: square footage, lot size, and finish level.
The Texas Insurance Stack
Home, flood, wind, hail, auto, and umbrella coverage explained for California relocators.
Sources
- Rentometer, U.S. Single-Family Rental Market Report: Mid-Year 2026
rentometer.com/2026-mid-year-single-family-rental-market-report - Redfin, West San Antonio Housing Market
redfin.com/neighborhood/549647/TX/San-Antonio/West-San-Antonio/housing-market - Redfin, Boerne Housing Market
redfin.com/city/2371/TX/Boerne/housing-market - Redfin, ZIP Code 78006 Housing Market
redfin.com/zipcode/78006/housing-market - The Wall Street Journal, 'America's Big Cities Are Rapidly Losing Kids'
wsj.com/us-news/cities-losing-families-children-a860a9b1 - U.S. Census Bureau, State-to-State Migration Flows
census.gov/data/tables/time-series/demo/geographic-mobility/state-to-state-migration.html - Texas Comptroller, Property Tax Exemptions; Texas Secretary of State, 2025 Constitutional-Amendment Explanatory Statements
comptroller.texas.gov/taxes/property-tax/exemptions/
sos.texas.gov/elections/forms/2025-explanatory-statements.pdf - Texas Department of Insurance, Texas Homeowners Insurance Market Overview
tdi.texas.gov/general/texas-homeowners-insurance-market-overview.html - Freddie Mac, Understanding What You Can Afford; Consumer Financial Protection Bureau, Debt-to-Income Ratio
myhome.freddiemac.com/buying/what-can-you-afford
consumerfinance.gov/ask-cfpb/what-is-a-debt-to-income-ratio-en-1791/ - California Franchise Tax Board, Maximum Personal Income-Tax Rate
ftb.ca.gov/about-ftb/data-reports-plans/summary-of-federal-income-tax-changes/index.html - California State Board of Equalization, Change in Ownership and Reassessment
boe.ca.gov/proptaxes/faqs/changeinownership.htm - Texas Education Agency, 2025 Boerne ISD Accountability Summary
rptsvr1.tea.texas.gov - Boerne ISD, Current District Size
boerneisd.net/community/community-engagement/partnerships - California Department of Real Estate, 2025 Landlord-Tenant Guide
dre.ca.gov/files/pdf/2025_Landlord_Tenant_Guide.pdf - Texas State Affordable Housing Corporation, Assistance Options - Non-Bond and Bond Down Payment Assistance
kb.tsahc.org/39170/kb/article/102806/33-assistance-options-nonbond-dpa-with-or-without-mcc-bond-dpa - Texas Department of Housing and Community Affairs, Texas Homebuyer Programs
welcomehome.tdhca.texas.gov/programs - Office of the New York City Comptroller, Child Care Affordability and the Benefits of Universal Provision
comptroller.nyc.gov/reports/child-care-affordability-and-the-benefits-of-universal-provision/
Last reviewed: July 28, 2026. Rental and home price data reflect mid-2026 published estimates. Individual rates, prices, and mortgage qualification vary. Verify with your lender and county appraisal district.