
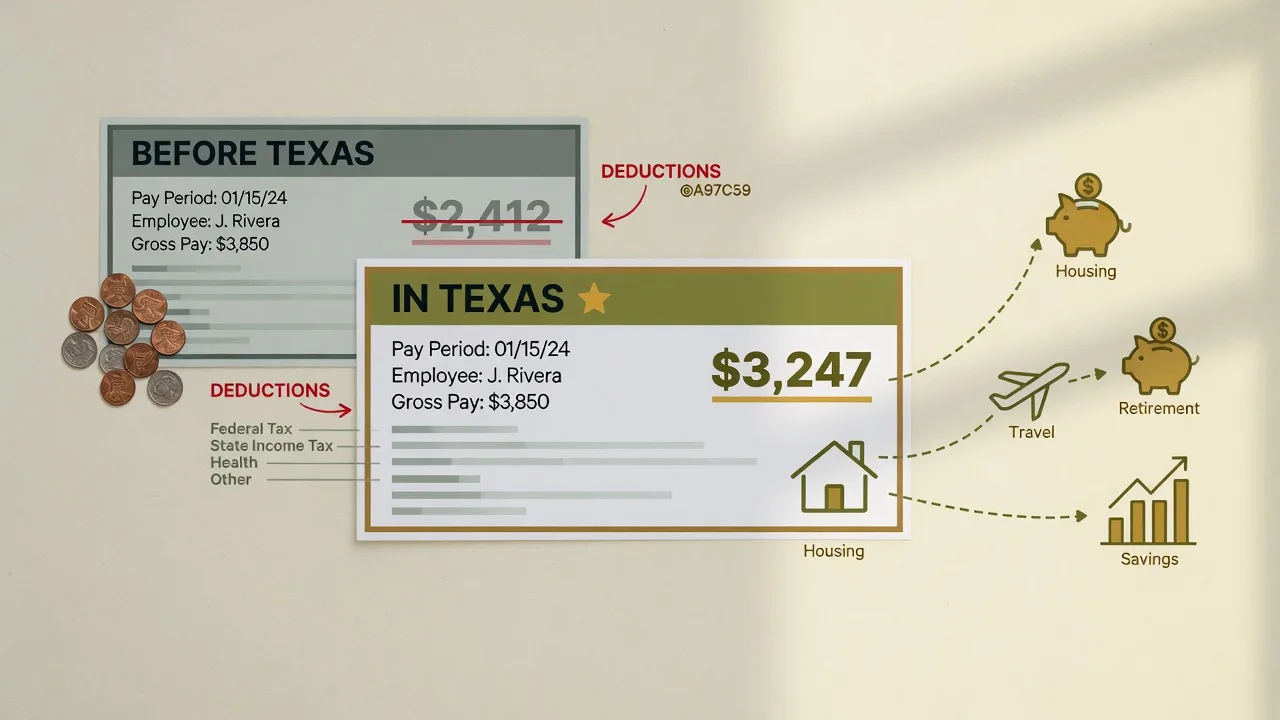
Let me talk to you like a person first, because you are in the middle of a big decision, not a data point. Maybe you have been turning the same questions over for months: what the paycheck would really look like, what the house would really cost, whether the move is the right one for your family. Friends and family have opinions, and you are carrying two fears at once, the fear of getting the math wrong and the fear of missing a better life by being too careful. I have walked through this arithmetic with dozens of households in exactly that spot, and the numbers deserve to be laid out plainly. Here is what this page does. It takes your paycheck apart in four layers and keeps each layer separate so you can see the mechanics: federal taxes, which follow the same rules in every state; state income taxes plus mandatory employee payroll contributions, where the origin state changes the number; what home the money supports in the Hill Country under specific, stated assumptions; and how regional price levels compare across eight origin metros using Bureau of Economic Analysis data. By the end, you will know what the same income keeps after taxes, what it buys in housing, and what is left over.
The translator below walks six household incomes, from $75,000 to $500,000, through the core paycheck-and-housing arithmetic under the stated assumptions: federal tax, the state income-tax difference, estimated after-tax income, a housing budget at a traditional 28%-of-gross-income front-end housing benchmark, what that budget supports in Kendall, Bexar, Comal, and Bandera counties with Boerne as the anchor, and what remains after housing before other living costs. Key tax, mortgage-rate, housing-market, property-tax, and regional-price figures are sourced at the bottom of the page, with the assumptions used in the model stated separately.
The origin sections then run the purchasing-power math for San Francisco, Los Angeles, San Diego, Seattle, Portland, Denver, Chicago, and New York/New Jersey, using the Bureau of Economic Analysis regional price parities rather than a single commercial cost-of-living index, so you can see how far the housing dollar and the overall dollar stretch when the state income tax and modeled payroll line changes [1].
This is the companion to the zero-state-income-tax article, which isolates the California tax line in depth. This page goes further: it stacks the federal line, the housing line, and the cash-remaining line on top of the state income tax and modeled payroll line, and it runs the same math for seven more origin markets. If you want the full housing-and-wealth version of one household's move, the wealth unlock article runs a $160,000 Los Angeles household through two states and four Texas markets.
The salary translator
Six income tiers from $75,000 to $500,000, with federal tax, state difference, estimated after-tax income, housing budget, and cash remaining after modeled housing in one grid.
The federal line
The part of the paycheck that does not change with the state income tax and modeled payroll line, shown so you can see the full picture.
The state income tax and modeled payroll line
The origin state's income tax and modeled payroll versus Texas's zero state individual income tax, tier by tier.
Housing and what it buys
The 28% housing budget, the modeled home price, and representative Texas options across the four counties.
Cash remaining after modeled housing
Cash remaining after the housing line, before other living costs, at every tier.
Eight origin markets
Purchasing power from San Francisco, Los Angeles, San Diego, Seattle, Portland, Denver, Chicago, and New York/New Jersey.
Your salary translator calculator
Enter your income and origin state to get your estimated after-tax income, housing budget, and cash remaining after modeled housing.
The questions people actually ask
Nine plain-English answers, from single filers to the property-tax question to how often to re-run the math.
1. The Salary Translator: Six Tiers, One Grid
Let's start with your household income and read straight across the table. That one grid holds the whole exercise: what the paycheck keeps after federal tax and FICA, what the state income tax and modeled payroll line takes in California versus the zero in Texas, the monthly estimated after-tax income, a housing budget set at the traditional 28% of gross income, the approximate purchase price that budget supports in the Hill Country, and what is left after housing before every other living cost.
I want you to be able to check every step, so here are the assumptions in plain language. The model looks at a married couple filing jointly, both earning W-2 wages, with no other income and the standard deduction. Federal tax follows the 2026 married-filing-jointly brackets and the $32,200 standard deduction [2]. FICA breaks down as Social Security at 6.2% of wages up to the $184,500 wage base, Medicare at 1.45% on all wages, and the extra 0.9% Additional Medicare Tax once combined wages pass $250,000 [3][24]. One simplifying choice worth naming: Social Security is modeled as if one spouse earns all the wages. In a real two-earner household each spouse gets their own $184,500 wage base, so at the $200,000-and-up tiers, two earners can owe more Social Security than the table shows. The California column follows the same convention the rest of this site uses: the 2026 Form 540-ES instructions, which point to the 2025 tax table, with the $11,412 joint standard deduction, the $306 joint exemption credit, and employee SDI at 1.3% of wages [4][5]. The Texas column is $0, because Texas has no state income tax [6].
Estimated after-tax income is shown two ways, and that is the heart of the page. The California figure subtracts federal income tax, FICA, and the California state income tax and modeled payroll line. The Texas figure subtracts only federal income tax and FICA. Each is divided by twelve to give a monthly number. Before you lean on it, one important distinction: these figures are estimated after-tax cash before voluntary payroll deductions such as health insurance and retirement contributions, so they are not the literal number on a pay stub. For housing, the page uses the traditional 28%-of-gross-income front-end benchmark. Think of it as a planning line, not a loan approval; an underwriter can allow a higher or lower ratio depending on the loan program, total debt, credit profile, reserves, down payment, taxes, insurance, HOA obligations, and other factors. The modeled home price assumes 20% down (an illustrative choice that avoids modeling mortgage insurance; many relocation and first-time buyers put down less), a 30-year fixed mortgage at an illustrative 6.5%, property tax at an illustrative 1.5% of price, and homeowners insurance at an illustrative planning placeholder of approximately 0.9% of price. Actual premiums vary by ZIP code, replacement cost, roof, construction, claims history, deductible, wind and hail exposure, coverage limits, and insurer, so get a property-specific quote before you rely on it [21][22]. Remaining after modeled housing is simply the Texas after-tax income minus the housing budget, because the housing budget is being spent in Texas.
Illustrative assumptions: married filing jointly; combined annual W-2 wages shown in the table; both spouses under age 65; no dependents; standard deduction; no other deductions, credits, or income; all wages subject to payroll tax. The California income-tax estimate follows the 2026 Form 540-ES instructions, which direct taxpayers to the 2025 tax table. Federal FICA includes Social Security at 6.2% on wages up to the 2026 wage base (modeled as one earner), Medicare at 1.45%, and the 0.9% Additional Medicare Tax on combined wages above $250,000. Illustrative mortgage rate: 6.5%. This is a scenario assumption, not the current Freddie Mac average. Homeowners insurance is an illustrative planning placeholder of approximately 0.9% of purchase price, not a rate derived from TDI data; actual premiums vary by ZIP code, replacement cost, roof, construction, claims history, deductible, wind/hail exposure, coverage limits, and insurer. Property tax is an illustrative 1.5% of purchase price. Figures are rounded.
Household income, translated: married filing jointly, California to Texas
| Household income | Federal income tax | FICA | CA state income tax + modeled payroll (TX: $0) | CA estimated after-tax income | TX estimated after-tax income | Housing budget (28%) | Modeled home price at 28% housing budget | Remaining after modeled housing (TX) |
|---|---|---|---|---|---|---|---|---|
| $75,000 | ~$4,640 | ~$5,738 | ~$1,940 | ~$5,224 | ~$5,385 | ~$1,750 | ~$248,000 | ~$3,635 |
| $100,000 | ~$7,640 | ~$7,650 | ~$3,380 | ~$6,778 | ~$7,059 | ~$2,333 | ~$331,000 | ~$4,726 |
| $150,000 | ~$15,340 | ~$11,475 | ~$7,500 | ~$9,640 | ~$10,265 | ~$3,500 | ~$496,000 | ~$6,765 |
| $200,000 | ~$26,340 | ~$14,339 | ~$12,710 | ~$12,218 | ~$13,277 | ~$4,667 | ~$661,000 | ~$8,610 |
| $300,000 | ~$49,468 | ~$16,239 | ~$23,310 | ~$17,582 | ~$19,524 | ~$7,000 | ~$992,000 | ~$12,524 |
| $500,000 | ~$102,608 | ~$20,939 | ~$44,510 | ~$27,662 | ~$31,371 | ~$11,667 | ~$1,653,000 | ~$19,704 |
WHAT THIS MODEL DOES NOT INCLUDE
This is a planning model, not a complete household budget or mortgage qualification. Unless specifically stated, it does not include employer health-plan deductions, retirement contributions, HSA/FSA contributions, childcare, auto debt, student loans, HOA dues, maintenance, utilities, groceries, transportation, local income taxes, mortgage insurance, closing costs, points, or property-specific insurance adjustments. The housing model assumes 20% down and uses illustrative property-tax, insurance, and mortgage-rate assumptions. Actual results require property-specific and household-specific inputs.
ONE-EARNER VERSUS TWO-EARNER HOUSEHOLDS
Social Security tax is capped separately for each worker. The default examples assume one spouse earns all household W-2 income. Two-earner households, particularly above $184,500 of combined wages, can have materially higher combined Social Security tax than the default example.
Modeled illustration per the assumptions above. The California figure is approximate state individual income tax plus employee SDI; the Texas figure is $0 [4][5][6]. The gap between the two estimated-after-tax-income columns is the monthly state-difference. Remaining after modeled housing uses the Texas estimated after-tax income, which is estimated after-tax cash before health insurance, retirement contributions, and other elective payroll deductions. The modeled home price is what the 28% housing budget carries at 20% down, an illustrative 6.5% for 30 years, ~1.5% property tax, and ~0.9% insurance as an illustrative planning placeholder, not a TDI-derived rate; actual insurance premiums vary by ZIP code, replacement cost, roof, construction, claims history, deductible, wind/hail exposure, coverage limits, and insurer, so obtain a property-specific quote [21][22]. It is a planning figure, not a loan approval. Your actual result depends on your deductions, credits, filing details, and the year you move. This is educational math, not tax advice.
Read the grid once and the pattern is unmistakable. The federal line climbs with income, and it does not care which state you live in, so it reads the same in California and Texas. The state income tax and modeled payroll line is where the move changes the number: California subtracts at every tier, Texas subtracts nothing. The monthly difference runs from roughly $162 at $75,000 to roughly $3,709 at $500,000, all before you touch the housing column, which is usually the bigger lever [1][4][5][6].
The housing column is the part people skip and then wish they had read. At $150,000, the modeled $496,000 purchase price lands within about 2% of the current Boerne median [16]. At $200,000, the modeled $661,000 purchase price runs about 8% below the current Fair Oaks Ranch median [18]. At $100,000, the modeled $331,000 purchase price sits above the current San Antonio median and about $16,000, or roughly 5%, below the current New Braunfels median [17][19]. That modeled price is a planning line, not a promise; the actual home depends on the lot, the school district, and the tax jurisdiction. One number to know before you shop: Freddie Mac's national 30-year fixed average was 7.28% as of October 1, 2026, up from 7.03% the week before. The 6.5% used in the primary model remains an illustrative scenario. Hold every other assumption and run 7.28% instead, and the $200,000 tier supports approximately $624,000 rather than approximately $661,000 [22].
2. The Federal Line: The Part That Does Not Change
Before we get excited about what Texas saves you, let's take a breath and be clear about what does not change. Federal income tax, Social Security, and Medicare follow the same federal rules in every state, so crossing the state line does not touch them. They appear in the translator so you can see the full picture of what a paycheck keeps, but they are not the line where the move changes the number between California and Texas.
Here is the 2026 federal math, briefly. The standard deduction for a married couple filing jointly is $32,200, and the brackets run from 10% up to 37% [2]. Social Security takes 6.2% of each worker's wages up to that worker's $184,500 wage base; Medicare takes 1.45% on all wages. The two only add up to 7.65% on wages still below the Social Security cap. Married couples also owe the 0.9% Additional Medicare Tax once combined wages pass $250,000 [3][24]. The table below stacks it all at each tier, and you can watch the pattern: the federal line grows steadily with income, while the state income tax and modeled payroll line is the only column that changes with the state you live in.
2026 federal tax and payroll, married filing jointly
| Household income | Taxable income | Federal income tax | Social Security | Medicare (incl. 0.9% Additional) | Total federal |
|---|---|---|---|---|---|
| $75,000 | $42,800 | ~$4,640 | ~$4,650 | ~$1,088 | ~$10,378 |
| $100,000 | $67,800 | ~$7,640 | ~$6,200 | ~$1,450 | ~$15,290 |
| $150,000 | $117,800 | ~$15,340 | ~$9,300 | ~$2,175 | ~$26,815 |
| $200,000 | $167,800 | ~$26,340 | ~$11,439 | ~$2,900 | ~$40,679 |
| $300,000 | $267,800 | ~$49,468 | ~$11,439 | ~$4,800 | ~$65,707 |
| $500,000 | $467,800 | ~$102,608 | ~$11,439 | ~$9,500 | ~$123,547 |
Modeled per the 2026 federal brackets and the $32,200 married-filing-jointly standard deduction, with Social Security capped at the $184,500 wage base for one earner and the 0.9% Additional Medicare Tax on wages above $250,000 [2][3][24]. These are the same annual figures Section 1 uses: Social Security plus Medicare equals Section 1's FICA column. Taxable income is gross income minus the standard deduction. None of these figures changes with the state income tax and modeled payroll line.
One honest note before you close this section. Federal itemized deductions can interact with the state income tax and modeled payroll line. If a household itemizes, state and local taxes are deductible on the federal return up to the SALT cap, which the 2025 federal tax law raised to $40,400 for 2026 for married couples filing jointly, phasing back down toward $10,000 once modified adjusted gross income passes $505,000 [25]. In California, state income tax plus property tax pushes many higher-income households to or past that cap. In Texas, property tax alone may fill less of it. Moving to Texas removes the state income tax but keeps the property tax, so your itemized picture can shift. This article models the standard deduction, the same convention this site uses across its cost pages, and does not model itemized deductions. The full cost page holds the deeper treatment [23].
I show the federal line for one reason, and it is not to make it look smaller or larger. It is to keep the comparison honest. The move changes the state income tax and modeled payroll line and the housing line, and it leaves the federal line alone. So when someone tells you the whole paycheck is bigger in Texas, the accurate version is more careful. Texas's state individual income-tax line is $0, and what the move actually removes from a household's paycheck depends on the origin state's income-tax and payroll-deduction structure. The federal line stays put, and the housing line depends on the market.
3. The State Income Tax and Modeled Payroll Line: California Versus Texas's Zero
This is the column the move actually changes, so let's slow down here. Texas has no state personal income tax, and that is not a rumor or a temporary program. The prohibition sits in the Texas Constitution as Article VIII, Section 24-a, adopted by voters in 2019, and reversing it would take a two-thirds vote in each legislative chamber plus another statewide referendum. That is why I treat the line as load-bearing rather than temporary [6].
California, by contrast, taxes personal income from 1% up to 12.3%, adds a separate 1% on taxable income above $1 million, and withholds State Disability Insurance at 1.3% of wages with no wage cap [4][5]. The table below shows the estimated California annual burden at each tier, Texas's burden of $0, and the monthly difference between them. It follows the same convention as the zero-state-income-tax article, so the numbers line up with the rest of the site.
Annual estimated state income tax and modeled payroll, married filing jointly
| Household income | CA state income tax + SDI | TX state individual income tax | Annual difference | Monthly difference | 5-year simple sum if modeled annual difference remained unchanged |
|---|---|---|---|---|---|
| $75,000 | ~$1,940 | $0 | ~$1,940 | ~$162 | ~$9,700 |
| $100,000 | ~$3,380 | $0 | ~$3,380 | ~$282 | ~$16,900 |
| $150,000 | ~$7,500 | $0 | ~$7,500 | ~$625 | ~$37,500 |
| $200,000 | ~$12,710 | $0 | ~$12,710 | ~$1,059 | ~$63,550 |
| $300,000 | ~$23,310 | $0 | ~$23,310 | ~$1,943 | ~$116,550 |
| $500,000 | ~$44,510 | $0 | ~$44,510 | ~$3,709 | ~$222,550 |
Modeled per the 2026 Form 540-ES instructions (2025 tax table), the $11,412 joint standard deduction, the $306 joint exemption credit, and employee SDI at 1.3% of wages, versus $0 in Texas [4][5][6]. The 5-year column is a simple undiscounted sum of one modeled year's annual difference multiplied by five. Tax laws, income, deductions, and payroll rates can change; this is not a five-year tax forecast. This isolates the state income tax and modeled payroll line; federal tax is outside it and does not change with the move.

This is the number I would carry in your head for the rest of the page: the monthly difference. At $200,000 it is roughly $1,059 a month, about $12,710 a year, kept on the state income tax and modeled payroll line alone [4][5]. At $300,000 it is roughly $1,943 a month, about $23,310 a year. That is a decision-sized number, not a rounding error, and it recurs every year you earn.
One caveat comes up with nearly every family that makes this move, and it deserves your attention: the move-year sourcing rules. California can keep taxing compensation tied to services performed in California even after you become a nonresident, including bonus or equity compensation earned for California work. This page models the steady-state year after the move, when wages are earned for services performed in Texas. The move year itself usually involves a part-year California return, and if you are moving with unvested equity or a pending bonus, have the move year modeled before you count the difference. The California exit tax section holds that detail [4][5].
Remote Worker Sourcing
After you physically relocate and begin performing services from Texas, promptly update your employer's HR and payroll records with your Texas residence and work location. Payroll withholding does not by itself determine legal tax liability. An origin state may still tax compensation sourced to services performed there, and special sourcing rules can apply to deferred or equity compensation. New York's convenience-of-the-employer rule can also cause some remote work performed outside New York to remain New York-source income when the employee's assigned or primary office is in New York. Confirm the sourcing treatment with payroll and a qualified tax professional before assuming withholding equals final liability.
4. Housing: What the 28% Line Buys in the Hill Country

This is where the move does its heaviest lifting, and where I want the honest numbers most visible. The housing budget in the translator is 28% of gross monthly income. In plain terms, that is a traditional front-end benchmark: plan on housing eating about 28 cents of every gross dollar. An underwriter can approve a higher or lower ratio depending on the loan program, total debt, credit profile, reserves, down payment, taxes, insurance, HOA obligations, and other factors, so take it as a planning line, not a loan approval. The modeled home price assumes 20% down (an illustrative choice that avoids modeling mortgage insurance; many relocation and first-time buyers put down less), a 30-year fixed mortgage at an illustrative 6.5%, property tax at an illustrative 1.5% of price, and homeowners insurance at an illustrative planning placeholder of approximately 0.9% of price. Real premiums vary by ZIP code, replacement cost, roof, construction, claims history, deductible, wind and hail exposure, coverage limits, and insurer, so get a property-specific quote before you commit [21][22].
The table below maps each budget to what it supports and where that lands across Kendall, Bexar, Comal, and Bandera counties, with Boerne as the anchor. The median benchmarks: Boerne at approximately $504,666, San Antonio at approximately $264,825, Fair Oaks Ranch at approximately $719,000, New Braunfels at approximately $347,265, and Bandera County at approximately $367,769 [16][17][18][19][36]. The first four are community-level figures; Bandera is labeled as a county-level figure on purpose. These are market-based illustrations, not listings, and no address is invented.
What each housing budget supports, and where it lands
| Household income | Housing budget (28%) | Modeled home price at 28% housing budget | Modeled home price at 7.28% scenario | Representative Texas options |
|---|---|---|---|---|
| $75,000 | ~$1,750/mo | ~$248,000 | ~$234,000 | Below the current San Antonio median; entry-level inventory may be available depending on location and property type. |
| $100,000 | ~$2,333/mo | ~$331,000 | ~$312,000 | Above the San Antonio median; below the New Braunfels and Bandera County medians. |
| $150,000 | ~$3,500/mo | ~$496,000 | ~$468,000 | Above the San Antonio, New Braunfels, and Bandera County medians; within about 2% of the Boerne median; below the Fair Oaks Ranch median. |
| $200,000 | ~$4,667/mo | ~$661,000 | ~$624,000 | Above the Boerne median; approximately 8% below the Fair Oaks Ranch median. |
| $300,000 | ~$7,000/mo | ~$992,000 | ~$937,000 | Above the current medians in all five cited markets. |
| $500,000 | ~$11,667/mo | ~$1,653,000 | ~$1,561,000 | Well above the current medians in all five cited markets; property-specific taxes, insurance, HOA assessments, and other carrying costs become increasingly important. |
The modeled home price at 28% housing budget assumes 20% down, 30 years at an illustrative 6.5%, ~1.5% property tax, and ~0.9% insurance as an illustrative planning placeholder [21][22]. Illustrative mortgage rate: 6.5%. This is a scenario assumption, not the current Freddie Mac average; the 7.28% column uses the Freddie Mac weekly average reported October 1, 2026, while retaining the other assumptions, and neither column represents prevailing market financing. Actual insurance premiums vary by ZIP code, replacement cost, roof, construction, claims history, deductible, wind/hail exposure, coverage limits, and insurer, so obtain a property-specific quote. Representative options are market-based illustrations by town and price range using published medians; they are not listings and no address is invented [16][17][18][19].
Let me read the table back in plain language. At $100,000, the modeled $331,000 price clears the current San Antonio median but lands about $16,000, or roughly 5%, below the current New Braunfels median [17][19]. At $150,000, the modeled $496,000 price sits within about 2% of the current Boerne median [16]. At $200,000, the modeled $661,000 price runs about 8% below the current Fair Oaks Ranch median [18]. At $300,000 and up, the modeled price is above the current medians in all five cited markets, and property-specific taxes, insurance, HOA assessments, and other carrying costs become increasingly important.
The property-tax column is the one I will not let you skip. Texas property tax runs higher than most California counties, with modeled Boerne stacks near 1.86% before exemptions and San Antonio near 2.27%, cited here as example rate stacks rather than universal rates [20][23]. The model itself uses 1.5% of purchase price as an illustrative effective property-tax assumption. Your actual taxes vary by address, taxing entities, appraised value, exemptions, and when the purchase happens. One detail buyers regularly miss: the $140,000 residence-homestead exemption applies to school-district taxable value; it does not mechanically reduce every taxing entity's bill. Run the example stacks and the picture shifts. Near the 1.86% Boerne figure, each modeled home price drops about 4%, so the $200,000 tier supports about $634,000 rather than $661,000, and near San Antonio's 2.27% it drops about 8%. The Prop 13 vs Texas property tax page runs the full treatment, including the $140,000 school-district homestead exemption, the additional $60,000 exemption for homeowners 65 and older or disabled, and the protest process [20]. Property tax and insurance are already inside the modeled-home-price math here, so they are not hidden; the property tax page just holds the rest of the story.
Texas Homestead Cap
For a qualifying residence homestead, Texas law generally limits the annual increase in a property's appraised value to 10 percent [35], so a homesteaded property cannot jump with the market the way an unhomesteaded property can. The cap begins the tax year after the owner first qualifies, so the first appraisal after a purchase can still reflect full market value. A buyer can apply for the exemption in the year of purchase rather than waiting for the next January 1. That distinction matters when relocating buyers compare Texas property-tax rates to origin-state rates, because the rate is one number and the appraised value the rate applies to is another. The 10% limitation applies to appraised value, not directly to the amount of the property-tax bill. The homestead-exemption coverage on the Prop 13 page walks through both pieces.
5. Cash Remaining After Modeled Housing

After the estimated federal and state taxes, FICA, and the modeled housing budget, the next number worth planning around is what is left over. Call it cash remaining before all other living expenses. I want to be plain about what it is not: it is not a savings forecast. Groceries, utilities, transportation, health care, childcare, debt service, maintenance, travel, and every other household expense still come out of that number.
Here is what that line looks like in Texas. At $75,000, roughly $3,635 a month remains. At $150,000, roughly $6,765. At $300,000, roughly $12,524. At $500,000, roughly $19,704. Each figure runs ahead of what the same household would have left in California by the monthly state difference. These are planning numbers under the married-filing-jointly convention, and they assume the housing budget is spent at exactly 28% of income. Spend less on housing and more is left; spend more and less is left.
Estimated after-tax income, housing line, and cash remaining after modeled housing
| Household income | TX estimated after-tax income | Housing budget (28%) | Cash remaining after modeled housing (TX) | CA after-tax income minus same 28% housing allowance |
|---|---|---|---|---|
| $75,000 | ~$5,385 | ~$1,750 | ~$3,635 | ~$3,474 |
| $100,000 | ~$7,059 | ~$2,333 | ~$4,726 | ~$4,444 |
| $150,000 | ~$10,265 | ~$3,500 | ~$6,765 | ~$6,140 |
| $200,000 | ~$13,277 | ~$4,667 | ~$8,610 | ~$7,551 |
| $300,000 | ~$19,524 | ~$7,000 | ~$12,524 | ~$10,582 |
| $500,000 | ~$31,371 | ~$11,667 | ~$19,704 | ~$15,995 |
Texas estimated after-tax income is annual income minus federal income tax and FICA, divided by twelve; the California column also subtracts the California state income tax and modeled payroll line. Both are estimated after-tax cash before voluntary payroll deductions such as health insurance, retirement contributions, and other elective payroll deductions. The CA after-tax income minus same 28% housing allowance column isolates the tax difference while holding the housing allowance constant; it does not represent the household's actual California housing expense. Cash remaining after modeled housing is estimated after-tax income minus the 28% housing budget; it is not a savings forecast and does not include the other costs of living, which the full cost page covers [23].
What matters about this column is not the single number. It is what the number does over time. A household that holds the remaining-cash line and invests the difference is compounding on top of a state income tax and modeled payroll line that is already $0 and a housing dollar that already goes further. The wealth unlock article runs the compounding table for a $160,000 household, and the equity-to-wealth article shows what a California home sale can add to that same remaining-cash line.
Now the honest caveat. The remaining-cash line is not a promise. It assumes housing sits at exactly 28% of income, and it does not subtract the other costs of living: utilities, groceries, fuel, and insurance. Texas electricity bills can run higher in the cooling season, and homeowners insurance is a line to quote before you commit [21][23]. Take the remaining-cash figure as the starting point for planning, not the ending point.
6. Eight Origin Markets: How Far the Dollar Stretches

The sections below measure buying power with Bureau of Economic Analysis regional price parities rather than a single commercial cost-of-living index. The BEA compares the relative price level of goods, services, and housing in each geographic area against a national average of 100 [1]. In plain terms, a parity above 100 means prices run above the national average there, and below 100 means they run under it. These are indexes, not literal household budgets. Every figure here is labeled by what it measures: the all-items price parity for overall goods and services, and the housing-rents parity for the cost of shelter. The two are not interchangeable, and I never mix them into one "median." BEA's housing-rents parity measures tenants' rents, not home purchase prices, so the housing comparisons below describe rent levels; the purchase-price math is in Section 4 [1].
The anchor is the destination, not the origin. Bexar, Comal, Kendall, and Bandera counties all sit inside the San Antonio-New Braunfels metro area, and that metro's 2024 all-items RPP was 94.716 with a housing-rents RPP of 94.575, both below the national level of 100 [26]. Every origin market below is measured against that single benchmark, so the comparisons stay metro to metro.
Against that benchmark, the San Francisco-Oakland-Hayward metro, all-items 115.613, runs about 22.1% higher overall. Los Angeles-Long Beach-Anaheim, 113.566, runs about 19.9% higher overall, with housing-rents at 170.433, about 1.80 times San Antonio. San Diego-Carlsbad, 111.887, runs about 18.1% higher [26]. Those gaps show up in a wallet, not just on a chart.
I call out the state income-tax line separately for each origin on purpose. Tax is a different measurement from the price level, and blending the two into one number hides more than it reveals.
San Francisco to Texas
Price level. San Francisco-Oakland-Hayward 2024 all-items RPP of 115.613 and housing-rents RPP of 194.718 (BEA metro figures), versus 94.716 and 94.575 for the San Antonio-New Braunfels metro [1][26].
What it means. Overall price level about 22.1% higher than the San Antonio-New Braunfels metro; housing-rents RPP about 2.06 times San Antonio. A representative basket priced at $100,000 at the San Antonio-New Braunfels RPP would correspond to roughly $122,100 at the San Francisco metro RPP [26].
State income tax. California taxes income from 1% up to 12.3%, with an extra 1% above $1 million, plus State Disability Insurance at 1.3% of wages. Texas takes none of it [4][5][6].
Los Angeles to Texas
Price level. Los Angeles-Long Beach-Anaheim 2024 all-items RPP of 113.566 and housing-rents RPP of 170.433 (BEA metro figures), versus 94.716 and 94.575 for the San Antonio-New Braunfels metro [1][26].
What it means. Overall price level about 19.9% higher than the San Antonio-New Braunfels metro; housing-rents RPP about 1.80 times San Antonio. A representative basket priced at $100,000 at the San Antonio-New Braunfels RPP would correspond to roughly $119,900 at the Los Angeles metro RPP [26].
State income tax. California state individual income tax plus employee SDI versus Texas's $0 state individual income tax. At $200,000 a married household keeps roughly $12,700 a year more on the state income tax and modeled payroll line alone [4][5][6].
San Diego to Texas
Price level. San Diego-Carlsbad 2024 all-items RPP of 111.887 and housing-rents RPP of 179.267 (BEA metro figures), versus 94.716 and 94.575 for the San Antonio-New Braunfels metro [1][26].
What it means. San Diego-Carlsbad's 2024 housing-rents RPP was 179.267 versus 94.575 for San Antonio-New Braunfels, a ratio of approximately 1.90 to 1. Overall price level about 18.1% higher than the San Antonio-New Braunfels metro. A representative basket priced at $100,000 at the San Antonio-New Braunfels RPP would correspond to roughly $118,100 at the San Diego metro RPP [26].
State income tax. The same California state individual income tax and employee SDI line versus Texas's $0 state individual income tax. The state-level difference recurs every year you earn [4][5][6].
Seattle to Texas
Price level. Seattle-Tacoma-Bellevue 2024 all-items RPP of 111.133 and housing-rents RPP of 151.314 (BEA metro figures), versus 94.716 and 94.575 for the San Antonio-New Braunfels metro [1][26].
What it means. Overall price level about 17% higher than the San Antonio-New Braunfels metro; housing-rents RPP about 60% higher. A representative basket priced at $100,000 at the San Antonio-New Braunfels RPP would correspond to roughly $117,300 at the Seattle metro RPP [26].
State income tax. Washington currently has no broad individual income tax on wages. Covered workers can, however, have mandatory payroll deductions including Washington Paid Family & Medical Leave and WA Cares: for 2026, Paid Leave has a total premium of 1.13% of wages up to the $184,500 Social Security cap, with the employee share up to 71.43% of the total premium, an effective maximum employee rate of approximately 0.807% of covered wages and a maximum employee contribution of approximately $1,489; WA Cares adds 0.58% of gross wages with no wage cap for covered workers [28][29]. At $200,000 of one-earner wages the two programs together represent approximately $2,649 per year: Paid Leave $1,489 plus WA Cares $1,160 [28][29]. Separately, the Washington Department of Revenue states that a new 9.9% individual income tax is scheduled to apply beginning January 1, 2028, after a $1 million standard deduction, with the first returns due in 2029 [13]. Washington also collects a capital-gains excise tax on high earners' long-term gains, 7% on taxable gains up to $1 million and 9.9% above that, after an inflation-indexed exemption ($278,000 for 2025) shared by married couples [13]. Initiative to the People IP26-645, concerning state and local taxes and titled 'An Initiative Prohibiting Individual Income Taxes,' has been certified for Washington's November 3, 2026 general-election ballot. Because the measure has not yet been voted on, future treatment remains unsettled [14]. Morgan Lewis provides optional secondary legal analysis of the signing and its expected challenges [27].
Portland to Texas
Price level. Portland-Vancouver-Hillsboro 2024 all-items RPP of 105.421 and housing-rents RPP of 125.114 (BEA metro figures), versus 94.716 and 94.575 for the San Antonio-New Braunfels metro [1][26].
What it means. Overall price level about 11.3% higher than the San Antonio-New Braunfels metro; housing-rents RPP about 1.32 times San Antonio. A representative basket priced at $100,000 at the San Antonio-New Braunfels RPP would correspond to roughly $111,300 at the Portland metro RPP [26].
State income tax. Oregon taxes income up to 9.9%, plus the Paid Leave Oregon payroll tax, with the employee share at 0.6% of wages up to the 2026 wage cap. At $200,000, under the married-filing-jointly assumptions used here, the modeled Oregon individual income tax plus Paid Leave Oregon and the Statewide Transit Tax totals approximately $16,400 for the year. The figure includes Oregon's federal-tax-liability subtraction and applicable personal-exemption credits under the published 2026 estimate rules [7][8][33]. For tax year 2026, Metro's Supportive Housing Services tax is 1% of Metro taxable income above $205,000 for joint filers. In Multnomah County, the Preschool for All tax is 1.5% of taxable income above $200,000 for joint filers, with an additional 1.5% above $400,000, producing a 3% marginal PFA rate above that level. Neither local tax is included in the statewide figure above [34].
Denver to Texas
Price level. Denver-Aurora-Lakewood 2024 all-items RPP of 105.782 and housing-rents RPP of 146.919 (BEA metro figures), versus 94.716 and 94.575 for the San Antonio-New Braunfels metro [1][26].
What it means. Overall price level about 11.7% higher than the San Antonio-New Braunfels metro; housing-rents RPP about 1.55 times San Antonio. A representative basket priced at $100,000 at the San Antonio-New Braunfels RPP would correspond to roughly $111,700 at the Denver metro RPP [26].
State income tax. Colorado uses a flat 4.4% state individual income tax. At $200,000 a married household keeps roughly $8,200 a year more in Texas: about $7,400 in Colorado state individual income tax (4.4% of federal taxable income) plus about $800 for the employee share of Colorado's FAMLI paid-leave premium (0.44% of wages up to the 2026 wage cap) [11][30].
Chicago to Texas
Price level. Chicago-Naperville-Elgin 2024 all-items RPP of 103.595 and housing-rents RPP of 112.010 (BEA metro figures), versus 94.716 and 94.575 for the San Antonio-New Braunfels metro [1][26].
What it means. Overall price level about 9.4% higher than the San Antonio-New Braunfels metro; housing-rents RPP about 1.18 times San Antonio. A representative basket priced at $100,000 at the San Antonio-New Braunfels RPP would correspond to roughly $109,400 at the Chicago metro RPP [26].
State income tax. Illinois uses a flat 4.95% state individual income tax. At $200,000 a married household keeps roughly $9,600 a year more on the state individual income tax line in Texas [12].
New York / New Jersey to Texas
Price level. New York-Newark-Jersey City 2024 all-items RPP of 112.563 and housing-rents RPP of 148.616 (BEA metro figures), versus 94.716 and 94.575 for the San Antonio-New Braunfels metro [1][26].
What it means. Overall price level about 18.8% higher than the San Antonio-New Braunfels metro; housing-rents RPP about 1.57 times San Antonio. A representative basket priced at $100,000 at the San Antonio-New Braunfels RPP would correspond to roughly $118,800 at the New York metro RPP [26].
State income tax. Both origin states are compared on the common New York-Newark-Jersey City metro RPP above, and their state tax systems are discussed separately here. New York taxes income up to 10.9% at the very top; New Jersey taxes income up to 10.75%. At $200,000, under the married-filing-jointly assumptions used here, the modeled New York state individual income tax is approximately $10,700 before New York Paid Family Leave; the comparable Texas state individual income-tax line is $0. At $200,000 a married household keeps roughly $8,600 more on the New Jersey state individual income tax line in Texas [9][10]. The New York City resident income tax, up to 3.876% for city residents, is not included in the state-only $200,000 comparison. Mandatory employee payroll contributions run on top of those lines: New York's 2026 Paid Family Leave employee contribution is 0.432% of gross wages, capped at $411.91 annually (statutory disability coverage is excluded from the model), and New Jersey's 2026 employee contributions for UI, disability, workforce development, and family leave total approximately $909 per year at $200,000 of covered one-earner wages [31][32]. The calculator adds both [31][32].
Read all eight origins and the pattern is the same, and I do not need to oversell it. Every one of the eight named origin metros has a 2024 all-items RPP above the national benchmark of 100 and above the San Antonio-New Braunfels metro's 94.716 [1]. That is a statement about measured regional price levels, not a blanket claim that every individual household is necessarily better off financially after relocating. On the tax side, Washington is the outlier, because it has no broad income tax on wages today, so a Seattle household's win is housing rather than tax, though covered workers still pay the Washington Paid Family & Medical Leave and WA Cares premiums [13][28][29]. Oregon, Colorado, Illinois, New York, and New Jersey all carry meaningful state individual income-tax lines that Texas removes [7][9][10][11][12][15], and the mandatory employee payroll programs across the origin states, California SDI, Oregon Paid Leave and the Oregon Statewide Transit Tax, Colorado FAMLI, Washington Paid Leave and WA Cares, New York Paid Family Leave, and New Jersey's UI, disability, and family-leave contributions, are modeled consistently in the calculator [5][8][28][29][30][31][32][33].
For geographic consistency, each named origin market is compared with the San Antonio-New Braunfels metropolitan area using BEA's 2024 metropolitan regional price parities. Tax rules stay state-level because income-tax and payroll-tax systems are imposed at the state level, except where separately identified local taxes apply.
7. Your Salary Translator Calculator
This is a working calculator that runs right here in your browser, not a static table. Enter your household income, pick your current state, and it returns your estimated tax lines, payroll contributions, after-tax income, a housing budget at the 28% line, and what cash remains after modeled housing. It follows the same conventions as every table above: married filing jointly, 2026 federal brackets and FICA, and each origin state's published income-tax brackets plus its modeled mandatory employee payroll programs, against Texas's $0. Every housing input is editable, with the current values prefilled: down payment, mortgage interest rate, property-tax rate, annual homeowners insurance, HOA, and optional PMI. The whole thing runs in your browser, and nothing you type is sent anywhere.
Your household income is always the sum of the two wage fields, so the federal, state, and housing lines all run on the same total. Social Security is computed separately per wage field, so enter a two-earner split and you will see the extra Social Security a two-earner household owes at the higher tiers. The default starts as one earner, with all wages in earner 1. Housing inputs are editable, prefilled at 20% down, an illustrative 6.5% 30-year mortgage rate, an illustrative 1.5% property-tax rate, insurance at approximately 0.9% of price, and no HOA or PMI. The 6.5% mortgage rate is a scenario assumption, not the current Freddie Mac average.
Educational estimate, not tax advice. Assumes married filing jointly, W-2 wages, standard deduction, and no other income; it does not model itemized deductions, credits, dependents, or the California move-year sourcing rules. Estimated after-tax income before voluntary payroll deductions is not literal paycheck take-home: health insurance, retirement contributions, and other elective payroll deductions still come out of it. The housing budget is 28% of gross monthly income. Defaults shown are $200,000 from Texas. State income tax and modeled mandatory employee payroll contributions use each origin state's published 2026 rates: California individual income tax plus employee SDI; Oregon income tax plus Paid Leave Oregon and the Oregon Statewide Transit Tax (0.6% up to the wage cap); Colorado income tax plus FAMLI (employee share 0.44% up to the wage cap); Washington Paid Family & Medical Leave (effective maximum employee rate approximately 0.807% up to $184,500) plus WA Cares (0.58%, no wage cap); New York income tax plus Paid Family Leave (0.432%, capped at $411.91 annually, with New York statutory disability coverage excluded from the model); New Jersey income tax plus employee UI, disability, workforce-development, and family-leave contributions (approximately $909 combined at $200,000 of covered one-earner wages); and Texas at $0 [4][5][7][8][11][12][28][29][30][31][32][33]. Local income taxes, such as New York City's and the Portland-area taxes, are not modeled. Homeowners insurance is an illustrative planning placeholder, not a TDI-derived rate; actual premiums vary by ZIP code, replacement cost, roof, construction, claims history, deductible, wind/hail exposure, coverage limits, and insurer. Property tax is an illustrative effective rate; actual taxes vary by address, taxing entities, appraised value, exemptions, and the timing of the purchase [2][3][20][21][22].
Frequently Asked Questions
The questions that come up every time a household runs this arithmetic for real, answered the way I would answer them across a kitchen table.
Is the salary translator a tax quote or an estimate?
It is an educational estimate built on published 2026 brackets, standard deductions, and FICA rates, using the same conventions this site uses across its cost and wealth pages. It models a married couple filing jointly with W-2 wages and no other income, takes the standard deduction, and does not model itemized deductions, credits, dependents, retirement contributions, or the California move-year sourcing rules. Your actual number depends on your specific return and the year you move. It is arithmetic to plan with, not a filing.
I am single, not married. Do these numbers apply to me?
A single filer has a smaller federal standard deduction ($16,100 for 2026) and different federal brackets, so federal income tax will differ at the same gross income. State tax also depends on the origin state and filing status; Texas individual income tax remains $0. The tables on this page should therefore not be applied directly to a single filer.
Why is the federal tax the same in both states?
Federal income tax, Social Security, and Medicare follow the same federal rules no matter which state you live in, so they are not the differentiator between California and Texas. They appear in the translator so you can see the full picture of what a paycheck keeps, but the state income tax and modeled payroll line is where the move changes the number. Texas simply has no state income tax to subtract, and California does [6].
Does the property tax erase the cash advantage?
It can, and it is the honest column. Texas property tax runs higher than most California counties, with modeled Boerne stacks near 1.86% before exemptions and San Antonio near 2.27% [20][23]. The full cost page on this site runs the coverage test: at higher incomes the state income-tax and modeled payroll advantage covers the modeled Texas property tax and insurance, and at lower incomes they do not, which is why housing price is often the bigger lever than the tax line [23]. The salary translator on this page isolates the paycheck; pair it with the property tax page before you commit.
I am coming from a state with no income tax, like Washington. Is Texas still worth it?
That depends primarily on housing costs, property taxes, insurance, mandatory payroll deductions, and the household's own priorities. Washington currently has no broad wage income tax, so the state income-tax difference is much smaller than it is for a California or Oregon household. Measured metro to metro, the Seattle-Tacoma-Bellevue 2024 all-items regional price parity of 111.133 sits approximately 17% above the San Antonio-New Braunfels metro's 94.716, and Seattle's housing-rents RPP of 151.314 sits approximately 60% above the San Antonio-New Braunfels metro's 94.575, so housing cost is the larger lever for a Seattle household [1][26]. Covered workers still face mandatory payroll deductions: Washington Paid Family & Medical Leave plus WA Cares run to approximately $2,649 a year at $200,000 of one-earner wages [28][29]. Separately, the Washington Department of Revenue states that a new 9.9% individual income tax is scheduled to apply beginning January 1, 2028, after a $1 million standard deduction, with first returns due in 2029; Initiative to the People IP26-645, concerning state and local taxes, has been certified for the November 3, 2026 general-election ballot, and because it has not yet been voted on, future treatment remains unsettled [13][14].
What does the 28% housing budget actually cover?
For planning purposes, this article uses a traditional 28%-of-gross-income front-end housing benchmark: housing expense at 28% of gross monthly income. Actual underwriting may permit a higher or lower housing ratio depending on the loan program, total debt, credit profile, reserves, down payment, taxes, insurance, HOA obligations, and other factors. That 28% is calculated on gross income, your pay before any deductions, not on net pay after deductions. The modeled home price in the table assumes 20% down (an illustrative assumption that avoids modeling mortgage insurance; many relocation and first-time buyers put down less), a 30-year fixed mortgage at 6.5% (a scenario assumption, not the current Freddie Mac average), property tax at an illustrative 1.5% of price, and homeowners insurance at an illustrative planning placeholder of approximately 0.9% of price. It is a planning line, not a loan approval. Lenders also weigh the back-end ratio (all debts), credit, reserves, and the specific property's tax and insurance. One plain-English note: pre-tax payroll deductions, such as health insurance premiums, 401(k) contributions, and other pre-tax deductions, reduce the cash flow actually available each month even though they do not lower the front-end DTI ratio, so the gross-income-based 28% line and your actual monthly budget can differ. The 28% figure is the same convention this site uses in its budget articles [22][23].
Are the example homes real listings?
No. The housing options in the translator are described by town and price range, not by address, and no address is invented. They are market-based illustrations built on published median prices for Boerne, San Antonio, Fair Oaks Ranch, and New Braunfels [16][17][18][19]. A specific home at any budget depends on the current inventory, the lot, the school district, and the tax jurisdiction, so verify current figures and get property-specific estimates before you rely on them.
How much cash remains after modeled housing across the six tiers?
The translator's remaining-cash column is estimated after-tax income minus the 28% housing budget. In Texas, it ranges from roughly $3,635 a month at $75,000 to roughly $19,704 a month at $500,000 under the married-filing-jointly convention. That is what is left for groceries, utilities, transportation, health care, childcare, debt service, maintenance, travel, and every other household expense after the modeled housing line. It is a planning figure, not a savings forecast, and it assumes the housing budget is actually spent at exactly 28% of income.
When should I re-run this math?
Once a year, and at any life change. Texas property values are generally set as of January 1, local tax rates develop through the summer, and tax brackets and wage bases change each year. Re-run the calculator with your new income, confirm your homestead exemption is on the property, and compare your actual insurance renewal against the estimate. The same date every year keeps the arithmetic honest.
What to Do Next
Treat the translator as a starting point, not a finish line. Run your own income through the calculator, then pair it with the full cost page for the other costs of living and the property tax page for the honest Texas tax bill. The Start Here page walks the whole decision in order, and the interstate playbook covers the logistics of selling in one state and buying in another.
And when you are ready to run your own numbers against real inventory, this page is here, and so am I. I have watched dozens of families make this exact call, and the difficult parts are usually logistical and personal rather than hidden line items. Bill Ross at Hill Country Homesteads Group, brokered by Keller Williams Boerne, coordinates California-to-Texas purchases through a direct network of more than 1,100 California real-estate agents. Reach me through the contact page, by email at Bill@HillCountryHomesteads.com, or by phone at (210) 294-9190 during business hours, 8 AM to 6 PM Central, Monday through Friday. The brokerage is at 116 Herff Rd, Suite 203, Boerne, TX 78006. A no-pressure conversation about your specific situation is the only thing on offer, and it costs you nothing but an hour.
The same framework lives across the other two sites: the Hill Country Homesteads homepage carries the Boerne and Kendall County market work, and texasprobatehomes.net covers the estate and probate side of a cross-state move.
The Bottom Line
Here is the plain version of what this page showed. Your federal taxes follow the same rules in every state, so they are not where the move changes the number. After-tax cash flow differs by origin state because of state income taxes and mandatory employee payroll contributions, and that difference recurs every year. The Hill Country housing budget is built on assumptions you can see and change: 28% of gross income, 20% down, an illustrative 6.5% rate, and illustrative property-tax and insurance placeholders, all adjustable in the calculator. And the Bureau of Economic Analysis metro-level regional price parities show what an identical basket costs in each of the eight origin markets compared with San Antonio-New Braunfels.
Run your own numbers through the calculator, and when you want to talk about the next step, I am here for that conversation.
Sources
Numbered sources, as cited in the body above. Primary authorities come first wherever one exists; secondary sources are labeled as such. Key figures were checked against these references as of the 'Last verified' date below. Time-sensitive figures, including mortgage rates and rolling housing medians, can change after publication.
- Regional Price Parities by State and Metro Area: Bureau of Economic Analysis. 2024 data, released February 19, 2026; next release scheduled December 10, 2026. State RPP data are used for state-level context only: California overall all-items price parity of 110.7 (highest state) and housing-rents parity of 154.3; Texas 97.1 overall and 96.5 rents; Washington 107.0 overall and 126.0 rents; Oregon 103.4 overall and 108.6 rents; Illinois 100.0 overall; New Jersey 108.8 overall (third-highest). Metro RPP data, not state data, are used for each named origin-market comparison and are cited where labeled below. Primary authority. www.bea.gov/data/prices-inflation/regional-price-parities-state-and-metro-area
- IRS releases tax inflation adjustments for tax year 2026: Internal Revenue Service. 2026 federal standard deduction of $32,200 for married filing jointly and $16,100 for single, and the 2026 federal brackets. Primary authority. www.irs.gov/newsroom/irs-releases-tax-inflation-adjustments-for-tax-year-2026-including-amendments-from-the-one-big-beautiful-bill
- Contribution and Benefit Base: Social Security Administration. 2026 Social Security (OASDI) wage base of $184,500; the maximum employee Social Security contribution is $11,439. Primary authority. www.ssa.gov/oact/cola/cbb.html
- 2026 Form 540-ES Estimated Tax Instructions: California Franchise Tax Board. The $11,412 joint standard deduction and the instruction to use the 2025 California tax table. Primary authority. www.ftb.ca.gov/forms/2026/2026-540-es-instructions.pdf
- Contribution Rates, Withholding Schedules, and Meals and Lodging Values: California Employment Development Department. 2026 State Disability Insurance rate of 1.3% of wages. Primary authority. edd.ca.gov/en/payroll_taxes/rates_and_withholding/
- Texas Constitution, Article VIII, Section 24-a: Texas Legislature. The constitutional prohibition on a Texas state personal income tax, adopted by voters in 2019. Primary authority. statutes.capitol.texas.gov/Docs/CN/htm/CN.8.htm
- 2026 Publication OR-ESTIMATE, Oregon Estimated Income Tax Instructions: Oregon Department of Revenue. 2026 married-filing-jointly estimated-tax figures: a standard deduction of $5,800; a personal exemption credit of $260 per qualifying exemption; a federal-tax-liability subtraction of up to $8,750; and the married-filing-jointly rate schedule of 4.75% through $9,100, 6.75% over $9,100 through $22,800, 8.75% over $22,800 through $250,000, and 9.9% above $250,000. Primary authority. www.oregon.gov/dor/forms/FormsPubs/publication-or-estimate_101-026_2026.pdf
- Paid Leave Oregon: Oregon Employment Department. The 2026 total Paid Leave Oregon rate of 1% of wages up to the $184,500 cap, with the employee share at 0.6%. Primary authority. paidleave.oregon.gov/employees/overview.html
- 2026 Instructions for Form IT-2105, Estimated Income Tax Payment Voucher for Individuals: New York State Department of Taxation and Finance. Provides the 2026 standard deduction, New York State rate schedules, and the required tax-computation worksheets for taxpayers above the applicable NYAGI thresholds. Primary authority. www.tax.ny.gov/pdf/current_forms/it/it2105i.pdf
- New Jersey income tax rates and tables: State of New Jersey, Division of Taxation. The New Jersey income-tax rate schedules and tax tables used for the 2026 married-filing-jointly bracket comparison; New Jersey has no standard deduction but allows a gross-income exemption set out in the division's personal-exemptions pages. Primary authority. www.nj.gov/treasury/taxation/taxtables.shtml
- Colorado Individual Income Tax Guide: Colorado Department of Revenue. The current Colorado individual income tax guide showing the flat 4.4% individual income tax rate. Primary authority. tax.colorado.gov/individual-income-tax-guide
- Illinois Department of Revenue: State of Illinois. The flat 4.95% Illinois individual income tax. Primary authority. tax.illinois.gov/
- Washington Department of Revenue: Washington Department of Revenue. Washington currently does not have an individual income tax. Beginning January 1, 2028, a 9.9% tax is scheduled to apply to individuals and married couples filing jointly with annual adjusted gross income exceeding $1 million; first returns are due in 2029. Primary authority. dor.wa.gov/taxes-rates/income-tax
- Initiative to the People IP26-645: Washington Secretary of State. The office's August 21, 2026 certification release confirms that Initiative to the People IP26-645, concerning state and local taxes and titled 'An Initiative Prohibiting Individual Income Taxes,' was certified for Washington's November 3, 2026 general-election ballot. Primary authority for certification and ballot status. www.sos.wa.gov/about-office/news/2026/secretary-state-certifies-candidates-and-measures-november-general-election
- State Individual Income Tax Rates and Brackets, 2026: Tax Foundation. Broad-context secondary reference for state income-tax structures across the origin states; not used here to support a specific tax number where a state revenue department supplies the primary source. taxfoundation.org/data/all/state/state-income-tax-rates-2026/
- Boerne, TX housing market: Redfin. Three-month median sale price of approximately $505,000 through August 2026; Boerne medians across recent months have run roughly $450,000 to $665,000 depending on the neighborhood and period. Secondary source. www.redfin.com/city/2371/TX/Boerne/housing-market
- San Antonio, TX housing market: Redfin. Median sale price of approximately $265,000 over the last three months. Secondary source. www.redfin.com/city/16657/TX/San-Antonio/housing-market
- Fair Oaks Ranch, TX housing market: Redfin. Three-month median sale price of $718,524 through August 2026, rounded in the article to approximately $719,000. Secondary source. www.redfin.com/city/6483/TX/Fair-Oaks-Ranch/housing-market
- New Braunfels, TX housing market: Redfin. Median sale price of approximately $347,000 over the last three months. Secondary source. www.redfin.com/city/13081/TX/New-Braunfels/housing-market
- Property Tax Exemptions: Texas Comptroller of Public Accounts. The $140,000 residence homestead exemption on the school-district taxable value and the filing process through the county appraisal district. Primary authority. comptroller.texas.gov/taxes/property-tax/exemptions/
- Texas homeowners insurance market overview: Texas Department of Insurance. Statewide and county-level homeowners-insurance market data. TDI reports statewide premium and coverage statistics but does not establish the article's 0.9%-of-purchase-price insurance assumption; that percentage is an illustrative planning placeholder. www.tdi.texas.gov/general/texas-homeowners-insurance-market-overview.html
- Primary Mortgage Market Survey: Freddie Mac. National 30-year fixed-rate average. The 6.5% used in the primary tables is an illustrative scenario; Freddie Mac reported a 7.28% weekly average as of October 1, 2026, up from 7.03% the prior week. Primary authority. www.freddiemac.com/pmms
- California vs Texas cost of living: the real numbers: MoveToTexas.net. This site's pillar page holding the income-tax conventions, the property-tax coverage test, and the July 2026 fuel and utility comparisons referenced in this article. Secondary source (site's own). movetotexas.net/real-cost-comparison/
- Topic No. 560, Additional Medicare Tax: Internal Revenue Service. The 0.9% Additional Medicare Tax on wages above $250,000 for married couples filing jointly. Primary authority. www.irs.gov/taxtopics/tc560
- One, Big, Beautiful Bill provisions: Internal Revenue Service. The state and local tax (SALT) deduction cap of $40,400 for 2026 and its income phase-down. Primary authority. www.irs.gov/newsroom/one-big-beautiful-bill-provisions
- BEA metropolitan regional price parities via FRED: BEA data via Federal Reserve Bank of St. Louis FRED. The BEA metropolitan RPP series covering 2024 all-items and housing-rents RPPs: San Antonio-New Braunfels 94.716/94.575; San Francisco-Oakland-Hayward 115.613/194.718; Los Angeles-Long Beach-Anaheim 113.566/170.433; San Diego-Carlsbad 111.887/179.267; Seattle-Tacoma-Bellevue 111.133/151.314; Portland-Vancouver-Hillsboro 105.421/125.114; Denver-Aurora-Lakewood 105.782/146.919; Chicago-Naperville-Elgin 103.595/112.010; New York-Newark-Jersey City 112.563/148.616. BEA is the originating primary authority; FRED is a distribution platform for BEA data. fred.stlouisfed.org/release/tables?rid=403&eid=233895
- Washington Adopts 9.9% Tax on Residents Earning Over $1 Million: Morgan Lewis. March 30, 2026 signing of SB 6346, effective date, and expected legal challenges. Optional secondary legal analysis; the primary authority for the law and its implementation is the Washington Department of Revenue and, for ballot status, the Washington Secretary of State. www.morganlewis.com/pubs/2026/03/washington-adopts-9-9-tax-on-residents-earning-over-1-million
- Paid Leave WA: Estimate your Paid Leave payments: Washington Employment Security Department. For 2026 the total Washington Paid Family & Medical Leave premium is 1.13% of gross wages up to the $184,500 Social Security cap, with employees paying up to 71.43% of the total premium. Primary authority. paidleave.wa.gov/estimate-your-paid-leave-payments/
- Washington Cares Fund: State of Washington. WA Cares is a separate long-term-care payroll premium of 0.58% of gross wages with no Social Security wage cap, distinct from Paid Family & Medical Leave, which uses a different rate and is capped at the $184,500 wage base. Primary authority. wacaresfund.wa.gov/
- Colorado FAMLI: Premium and benefits calculator: Colorado Department of Labor and Employment. The 2026 FAMLI total premium of 0.88% of wages, split 50/50, with the employee share at 0.44% on wages up to the $184,500 federal Social Security wage cap. Primary authority. famli.colorado.gov/individuals-and-families/how-famli-works/premium-and-benefits-calculator
- New York Paid Family Leave Updates for 2026: New York State. The 2026 Paid Family Leave employee contribution of 0.432% of gross wages, capped at $411.91 annually. Primary authority. paidfamilyleave.ny.gov/2026
- New Jersey rate information, contributions, and due dates: New Jersey Department of Labor and Workforce Development. 2026 employee contributions on their respective wage bases: UI 0.3825% on the first $44,800, disability 0.19% on the first $171,100, workforce development 0.0425% on the first $44,800, and family leave 0.23% on the first $171,100; approximately $909 combined at $200,000 of covered one-earner wages. Primary authority. www.nj.gov/labor/ea/employer-services/rate-info/
- Statewide Transit Tax: Oregon Department of Revenue. Statewide Transit Tax. The tax is withheld from covered employee wages at one-tenth of 1 percent (0.001). Primary authority. www.oregon.gov/dor/programs/businesses/pages/statewide-transit-tax.aspx
- Personal Income Tax Filing and Payment Information: City of Portland, Revenue Division. Tax year 2026 rates and exemption thresholds for the local personal income taxes the City administers: Metro's Supportive Housing Services tax at 1% above $205,000 for joint filers, and Multnomah County's Preschool for All tax at 1.5% above $200,000 for joint filers with an additional 1.5% above $400,000. Primary authority. www.portland.gov/revenue/personal-tax
- Valuing Property: Limitation on Residence Homestead Value Increases: Texas Comptroller of Public Accounts. Valuing Property, Limitation on Residence Homestead Value Increases. A qualifying residence homestead's appraised value generally may not increase more than 10% per year under Tax Code Section 23.23, subject to the statutory calculation and new-improvement rules. The limitation takes effect January 1 of the tax year following the year the owner qualifies for the residence-homestead exemption. Primary authority. comptroller.texas.gov/taxes/property-tax/valuing-property.php
- Bandera County, TX housing market: Redfin. Bandera County, TX Housing Market. Three-month median sale price of $367,769 through August 2026, rounded in the article to approximately $368,000. Secondary source. www.redfin.com/county/2649/TX/Bandera-County/housing-market
Last verified: October 1, 2026. The federal brackets, state rates, BEA price parities, and median prices cited above are the published readings referenced here and will be updated as new data appears. Confirm anything time-sensitive with the IRS, the relevant state revenue department, the Bureau of Economic Analysis, the county appraisal district, the Texas Department of Insurance, and a tax professional before relying on it.