

Last updated: August 3, 2026 — reflects current data from utility providers, insurance carriers, and government sources.
When California buyers ask me what their monthly budget will look like in Texas, the first question is always about housing: "How much house can I get for $800,000?" That is a fair question, and the answer is dramatically more square footage and acreage than California offers at that price point. But the second question is the one that often catches people off guard: "What will I actually spend each month on everything else?" This article is a detailed cost of living California vs Texas comparison for the categories no one thinks about first.
Housing gets the headlines — and the savings are substantial — but the day-to-day costs of living in Texas versus California produce a quieter, more predictable kind of financial relief. The data shows that a typical family of four moving from the Bay Area to Boerne saves roughly $300-500 per month on non-housing costs alone. From Los Angeles to Fair Oaks Ranch, the savings are $250-450. From Sacramento to San Antonio, $150-350.
Those numbers assume nothing about housing cost differences or income tax savings. They are purely the cost of keeping the lights on, feeding your family, insuring your home and cars, filling your gas tank, and eating out occasionally. This article breaks those costs down city by city so you can see how your specific situation compares.
City-by-City Monthly Cost Comparison: California vs. Texas
The following table compares eight key expense categories across three common California-to-Texas relocation corridors. These are monthly estimates for a family of four with two cars, a 2,000-2,500 square foot home, and average consumption patterns in each region [1][9].
Bay Area / Silicon Valley to Boerne
| Expense | San Francisco / San Jose | Boerne | Difference |
|---|---|---|---|
| Electricity (avg monthly) | $195 | $275 | +$80 (TX higher) |
| Natural gas (avg monthly) | $125 | $85 | -$40 |
| Water / sewer (avg monthly) | $120 | $90 | -$30 |
| Auto insurance (2 cars) | $220 | $170 | -$50 |
| Homeowners insurance | $180 | $260 | +$80 (TX higher) |
| Groceries (family of 4) | $1350 | $1020 | -$330 |
| Fuel (2 cars, 12K mi/yr) | $440 | $335 | -$105 |
| Dining out (4x/month) | $520 | $340 | -$180 |
| Monthly Total (non-housing) | $3,150 | $2,575 | -$575/mo |
Estimates based on BLS Consumer Expenditure Survey [1], EIA [4], TDI/CDI [5][6], AAA [7], USDA [8], NUMBEO [9]. Actual costs vary by home size, family size, driving habits, coverage levels, and specific utility rate plans.
Los Angeles / Orange County to Fair Oaks Ranch
| Expense | Los Angeles / Orange County | Fair Oaks Ranch | Difference |
|---|---|---|---|
| Electricity (avg monthly) | $210 | $280 | +$70 (TX higher) |
| Natural gas (avg monthly) | $110 | $82 | -$28 |
| Water / sewer (avg monthly) | $115 | $95 | -$20 |
| Auto insurance (2 cars) | $240 | $175 | -$65 |
| Homeowners insurance | $210 | $270 | +$60 (TX higher) |
| Groceries (family of 4) | $1280 | $1040 | -$240 |
| Fuel (2 cars, 12K mi/yr) | $425 | $340 | -$85 |
| Dining out (4x/month) | $490 | $355 | -$135 |
| Monthly Total (non-housing) | $3,080 | $2,637 | -$443/mo |
Estimates based on BLS Consumer Expenditure Survey [1], EIA [4], TDI/CDI [5][6], AAA [7], USDA [8], NUMBEO [9]. Actual costs vary by home size, family size, driving habits, coverage levels, and specific utility rate plans.
Sacramento / Central Valley to San Antonio
| Expense | Sacramento / Central Valley | San Antonio | Difference |
|---|---|---|---|
| Electricity (avg monthly) | $225 | $295 | +$70 (TX higher) |
| Natural gas (avg monthly) | $100 | $88 | -$12 |
| Water / sewer (avg monthly) | $105 | $100 | -$5 |
| Auto insurance (2 cars) | $195 | $185 | -$10 |
| Homeowners insurance | $190 | $295 | +$105 (TX higher) |
| Groceries (family of 4) | $1180 | $1060 | -$120 |
| Fuel (2 cars, 12K mi/yr) | $395 | $350 | -$45 |
| Dining out (4x/month) | $430 | $370 | -$60 |
| Monthly Total (non-housing) | $2,820 | $2,743 | -$77/mo |
Estimates based on BLS Consumer Expenditure Survey [1], EIA [4], TDI/CDI [5][6], AAA [7], USDA [8], NUMBEO [9]. Actual costs vary by home size, family size, driving habits, coverage levels, and specific utility rate plans.
The $300-500 Monthly Non-Housing Advantage
Across all three relocation corridors, the monthly non-housing savings range from $150 to $500 depending on the specific cities. The Bay Area to Boerne corridor shows the largest savings because Bay Area costs are highest across nearly every category. Sacramento to San Antonio shows the smallest savings because Sacramento's cost of living is already lower than coastal California. But even the modest $156 monthly savings in that corridor adds up to nearly $1,900 per year.
What Moves the Needle: A Category-by-Category Breakdown
Not every expense category changes by the same amount. Understanding which costs go up, which go down, and which stay roughly the same helps you budget accurately and avoid surprises. Here is the annual picture for a Bay Area family moving to Boerne [1][4][5][7][8].
Annual Cost Comparison: Bay Area to Boerne (Family of 4)
| Category | California (annual) | Texas (annual) | Annual Difference |
|---|---|---|---|
| Electricity | $2,520 | $3,420 | +$900 (TX higher) |
| Natural gas | $1,340 | $1,020 | -$320 |
| Water / sewer | $1,380 | $1,140 | -$240 |
| Auto insurance (2 cars) | $2,640 | $2,120 | -$520 |
| Homeowners insurance | $2,280 | $3,320 | +$1,040 (TX higher) |
| Groceries (family of 4) | $15,480 | $12,480 | -$3,000 |
| Fuel (2 cars, 12K mi/yr) | $5,040 | $4,080 | -$960 |
| Dining out (4x/month) | $5,760 | $4,200 | -$1,560 |
| Annual Total (non-housing) | $36,440 | $31,780 | -$4,660/yr |
The biggest surprise for most California buyers is groceries. The difference of $3,000 per year reflects both lower base prices in Texas and the presence of H-E-B, which consistently undercuts California's major grocery chains by 15-25% on a basket of common items [8]. Fuel is second, with California's state gas tax (57.9 cents/gallon) nearly three times Texas's rate (20 cents/gallon) [13].
The two categories where Texas costs more — electricity and homeowners insurance — are important to budget for. Summer air conditioning in the Hill Country is not optional, and homes in the $400,000-$600,000 range typically run $250-400 per month for electricity during June through September [4]. Homeowners insurance is higher due to hail, wind, and storm exposure, and the gap widens for homes in higher-risk areas [5].
The Sales Tax Factor: Small Difference, Predictable Impact
Sales tax is one of the few expense categories where the California-to-Texas difference is small enough that most relocators do not notice it. But it is worth understanding because it affects every purchase you make.
California's state base rate is 7.25%, with local add-ons that push the combined rate to 7.25-10.25% depending on the city and county. San Francisco's combined rate is 8.625%. Los Angeles is 9.5%. Sacramento is 8.75%. In the Texas Hill Country, the combined rate is 8.25% across Boerne, Fair Oaks Ranch, and San Antonio — the maximum allowed when local option taxes are included [2][3].
For a household spending $20,000 per year on taxable goods (a reasonable figure for a family of four), the difference between San Francisco's 8.625% and the Hill Country's 8.25% is a mere $75 per year. Between Los Angeles (9.5%) and the Hill Country, the difference is $250 per year. These are not the numbers that drive a relocation decision. But they are one more small item in the "Texas costs less" column.
One important caveat: Texas does not tax groceries (food for home preparation) at the full sales tax rate, while most California cities do. This adds another hidden savings of roughly $150-300 per year for a family of four, depending on their grocery spending.
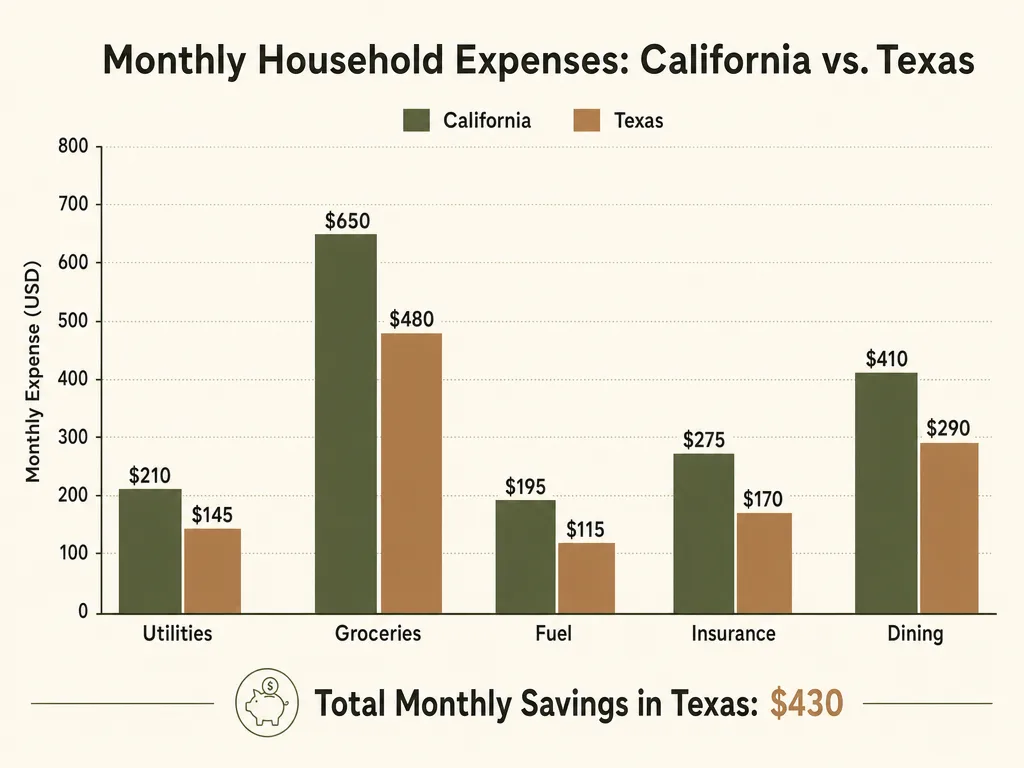
Monthly expense comparison across eight categories. Data reflects averages for a family of four in each region.
Nuances That Matter: Seasonal, Regional, and Lifestyle Adjustments
The averages above are useful for ballpark budgeting, but every family's actual costs differ based on several factors that the averages do not capture.
Seasonal utility swings
In California, utility costs are relatively stable month to month. In Texas, they swing dramatically. A Hill Country household might pay $180 for electricity in March and $420 in August. This seasonal spike catches many California transplants off guard, especially during their first summer when they discover that the "set it and forget it" AC approach from coastal California does not work the same way here. Budget for summer electricity to be 2-2.5x your winter average [4][10].
Home size matters more in Texas
A 3,000 square foot home in Texas costs significantly more to heat, cool, insure, and maintain than a 1,500 square foot home in California. Because Texas homes are typically larger — the median new home in the Hill Country is roughly 2,300 square feet versus 1,700 in California — some of the per-square-foot cost advantage is offset by the need to condition and cover more space. Your total utility and insurance bills may end up close to your California numbers even though the rates are lower, simply because the home is bigger [12].
Driving distances are real
The Hill Country is spread out. A trip to the grocery store may be 10-15 minutes rather than 5. The nearest Home Depot may be 20 minutes away. The kids' sports practice may be in a different town. Fuel costs in Texas per gallon are lower, but the miles driven per year tend to be higher. Most relocators I work with end up driving 15-25% more miles per year in Texas than they did in California. The net effect is still a fuel savings, but not as dramatic as the per-gallon price difference suggests [7][9].
Insurance costs vary by ZIP code
Within the Hill Country, insurance rates vary significantly. A home in a wildfire risk zone near the Balcones Canyonlands may have a substantially higher homeowners premium than a home in a denser suburban development. Auto insurance rates also vary by ZIP code, with rural Kendall County typically lower than densely populated Bexar County (San Antonio). Always get quotes from multiple carriers before closing, and factor the actual premium into your monthly budget [5][6].

H-E-B is the dominant Texas grocery chain and consistently prices 15-25% below California equivalents.
Putting It All Together: What Your Monthly Budget Actually Looks Like
Here is what a complete monthly budget looks like for a family of four earning $175,000, moving from the Bay Area to a $550,000 home in Boerne:
California (Bay Area)
Texas (Boerne)
$3,898/mo savings
$46,776 per year in additional disposable income
The non-housing savings of $390 per month are meaningful, but they are the smallest piece of the overall financial picture. The housing cost difference ($2,400 per month lower) and the state income tax savings ($1,108 per month) dominate the budget comparison. Together, they create nearly $4,000 per month in additional disposable income for a typical Bay Area-to-Boerne relocator.
The non-housing savings alone are not a reason to move. But they are a reason to feel confident that your day-to-day budget in Texas will not be a source of financial strain. When combined with the housing and tax advantages, they turn a good financial decision into an overwhelmingly favorable one.
Frequently Asked Questions
These are the cost-of-living questions I hear most often from California buyers during their initial consultation calls. The answers reflect what I have seen across dozens of real client transactions.
Are utility costs really that different between California and Texas?
Yes, but the direction depends on the utility. Electricity is consistently 25-35% higher in Texas due to summer air conditioning loads and the deregulated ERCOT market, where wholesale prices can spike during heat waves. Natural gas, water, and sewer tend to be 15-25% lower in Texas. The net effect for most households is that total utility spending is roughly comparable, with the Texas summer AC bill offsetting winter heating and water savings. The key difference is seasonal timing: Texas summer bills spike dramatically while California's are more evenly distributed throughout the year.
How much do groceries actually cost in Texas vs California?
For a family of four, the difference is roughly $200-300 per month in favor of Texas, or about 15-20% less. The largest savings come from meat and produce, which are significantly cheaper in Texas due to shorter supply chains and lower transportation costs. Dairy and packaged goods are closer in price. H-E-B, the dominant Texas grocer, is consistently priced 15-25% below California equivalents like Safeway, Ralphs, and Vons. ALDI and Walmart are also well-represented in Texas and offer additional savings.
Why is homeowners insurance more expensive in Texas?
Texas has one of the highest homeowners insurance costs in the country due to exposure to hail, windstorms (including hurricanes along the Gulf Coast), and tornadoes. The average annual premium in Texas is roughly $2,800-3,500 depending on location and coverage, compared to $1,800-2,400 for a comparable home in California (excluding earthquake insurance, which is separate). However, California earthquake insurance can add $800-3,000+ per year, partially offsetting the difference. When comparing total insurance costs including auto and umbrella, the gap narrows further because Texas auto rates are typically 10-15% lower than California's.
Is it true that gas is cheaper in Texas?
Yes. Texas fuel taxes are lower than California's: Texas has a state gas tax of 20 cents per gallon plus 18.4 cents federal, while California's state gas tax is 57.9 cents per gallon plus 18.4 cents federal — nearly three times higher. As of mid-2026, regular unleaded in the Hill Country averages about $3.00-3.30 per gallon compared to $4.60-5.20 in California. For a two-car household driving 12,000 miles per year each, this saves roughly $80-100 per month.
How does sales tax compare between California cities and Texas cities?
California's base sales tax is 7.25% with local add-ons that bring the total to 7.25-10.25%, depending on the city and county. Texas has a state sales tax of 6.25% with local options up to 2%, for a combined rate of 6.25-8.25%. In practice, San Francisco has a combined rate of 8.625%, Los Angeles 9.5%, and Sacramento 8.75%. In the Hill Country, Boerne is 8.25% (Kendall County max), San Antonio is 8.25%, and Fair Oaks Ranch is 8.25%. The difference is 0.375-1.25% depending on the specific cities, which amounts to roughly $75-250 per year in additional sales tax on $20,000 of taxable purchases.
Build Your Own Budget Comparison
The numbers in this article are based on averages, but your situation is specific. Your home size, your driving habits, your family's grocery list, and your insurance profile all affect the actual monthly costs you will face. A general comparison can point you in the right direction, but a direct conversation with someone who has done this work with dozens of California families can help you build an accurate budget for your specific scenario.
If you would like to run through your own cost comparison, I am happy to have that conversation. No pressure, no sales pitch — just the data, the tradeoffs, and a practical picture of what your monthly budget would actually look like in the Hill Country.

Written by
Bill Ross
Hill Country Homesteads Group, brokered by KW Boerne
Bill Ross is a Texas real estate agent with nearly four decades in high-tech sales and a network of 1,000+ California real estate agents for coordinated cross-state transactions. Featured in national coverage discussing his family's relocation from Silicon Valley to the Texas Hill Country, Bill helps California families navigate every aspect of the move to the Texas Hill Country.
Common Questions About California vs. Texas Cost of Living
How much can I save by moving from California to Texas?
Savings vary dramatically based on your California origin, household income, lifestyle, and the Texas community you choose. California's state income tax (up to 13.3%) is eliminated entirely in Texas, which is the single largest savings factor for higher-income households. Housing costs are also significantly lower in most Hill Country communities compared to coastal California. See our real cost comparison for a detailed breakdown.
Is everything cheaper in Texas than California?
Not everything. Texas property taxes are generally higher than California's, especially after Proposition 13 protections. Homeowner's insurance can also be higher in parts of the Hill Country due to hail and wind exposure. Groceries, childcare, and some services may be comparable. The net savings depend on your specific situation -- use our cost comparison tool to model your personal scenario.
Related Guides
Income Tax Arbitrage
What zero state income tax actually means for your monthly budget, with real numbers across six income scenarios.
California Home Equity to Texas Wealth
The real math behind selling in California and buying in Texas, with transaction costs and capital gains effects.
The Texas Insurance Stack
Home, flood, wind/hail, auto, and umbrella coverage explained for California relocators.
Property Tax Shock or Relief
A line-by-line comparison of property tax bills between California and Texas for comparable homes.
Sources
- US Bureau of Labor Statistics — Consumer Expenditure Survey, 2025 — BLS, 2025. www.bls.gov/cex/
- Texas Comptroller of Public Accounts — Sales Tax Rates — Texas Comptroller. comptroller.texas.gov/taxes/sales/
- California Department of Tax and Fee Administration — California City and County Sales and Use Tax Rates — CDTFA. www.cdffa.gov/taxes-and-fees/sales-tax-rates.htm
- US Energy Information Administration — Average Energy Prices, Texas vs California — EIA, 2026. www.eia.gov/state/
- Texas Department of Insurance — Average Homeowners Insurance Premiums by County — TDI, 2026. www.tdi.texas.gov/reports/
- California Department of Insurance — Average Homeowners Insurance Premiums — CDI, 2026. www.insurance.ca.gov/
- American Automobile Association — Average Auto Insurance Rates by State, 2026 — AAA, 2026. www.aaa.com/autorepair/articles/auto-insurance-rates-by-state
- USDA Economic Research Service — Food Prices and Spending by State — USDA ERS, 2026. www.usda.gov/ers/food-prices
- NUMBEO Cost of Living Index — San Antonio vs Los Angeles vs San Francisco — NUMBEO, 2026. www.numbeo.com/cost-of-living/
- Texas Water Development Board — Residential Water Rates Survey — TWDB, 2025. www.twdb.texas.gov/waterplanning/
- California Public Utilities Commission — Average Residential Utility Costs — CPUC, 2026. www.cpuc.ca.gov/
- Zillow Research — Housing Market Data and Cost of Living Comparisons — Zillow, 2026. www.zillow.com/research/
- American Petroleum Institute — State Gas Tax Rates, 2026 — API, 2026. www.api.org/oil-and-natural-gas/consumer-information/motor-fuel-taxes
Last reviewed: August 3, 2026. Cost data reflects averages from the most recent available sources. Individual rates vary. Verify current pricing with local providers before making budget decisions.